Service Threshold Backlog Analysis
Objective: Gain an understanding of the Service Threshold Backlog Analysis report
The Service Threshold Backlog Analysis report displays the network portfolio movement of the asset stock between service states, year-on-year, and the associated financial movement, using the Service Criteria defined in the model Template's Advanced Configuration.
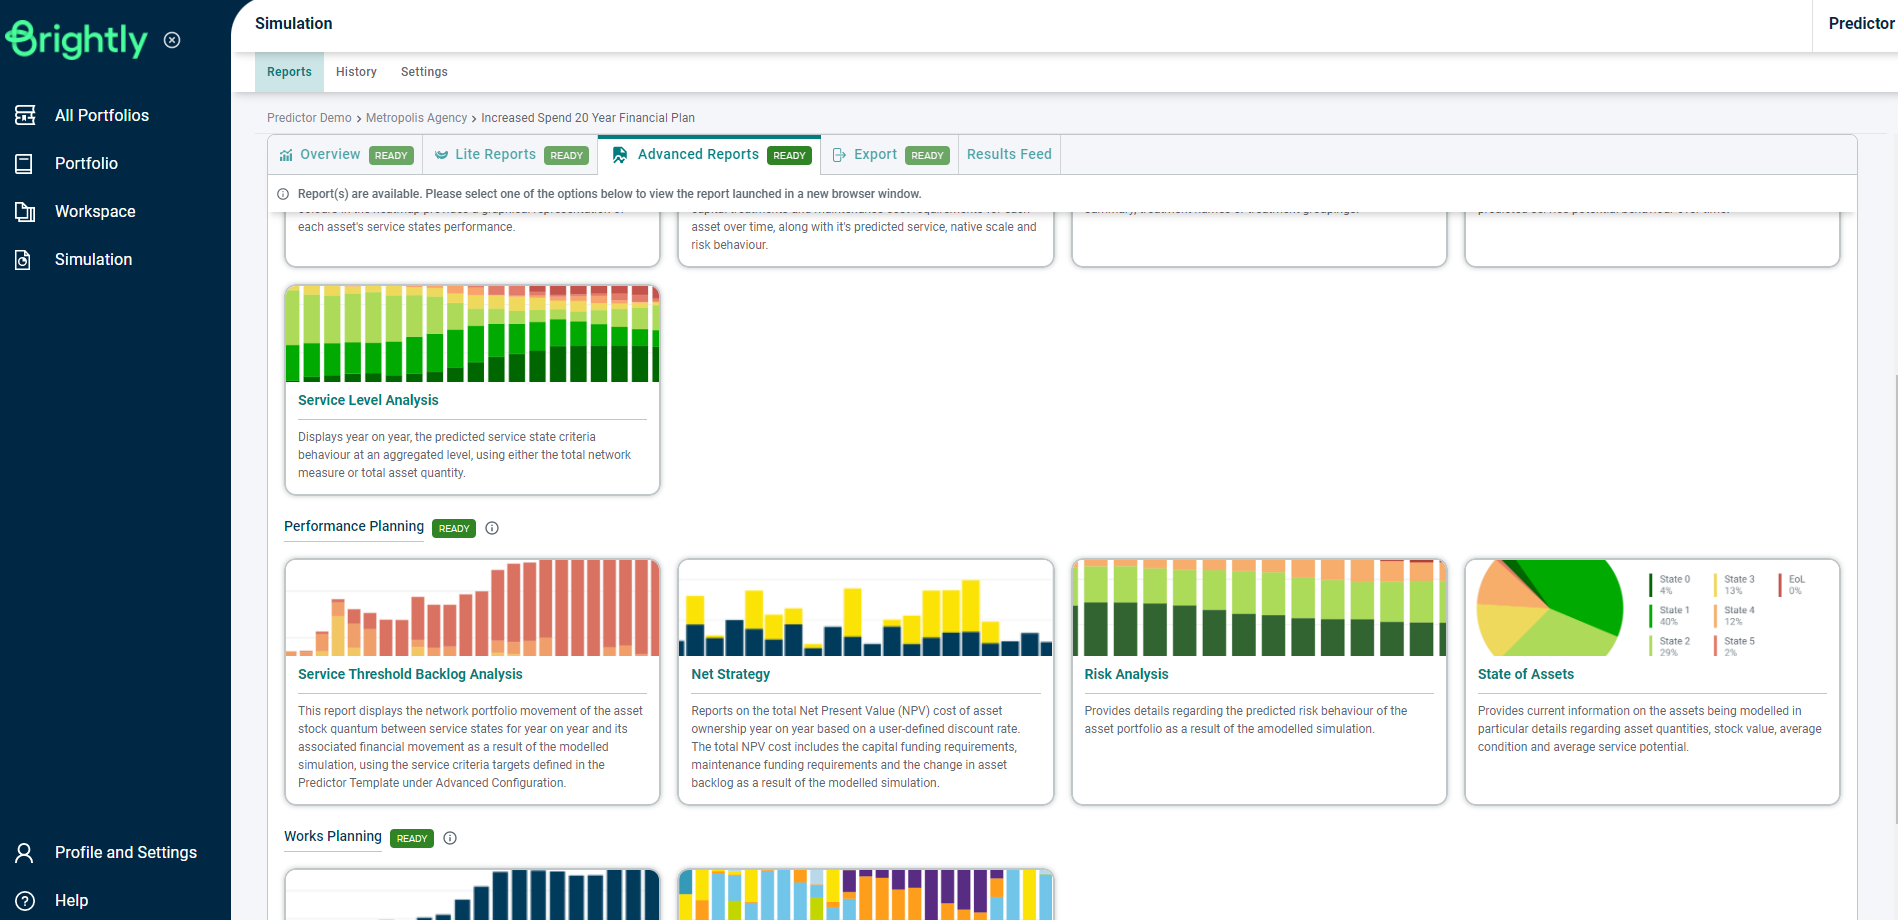
Once the Simulation is loaded, users can click on the 'Service Threshold Backlog Analysis' report in the Advanced Reports tab, under the Performance Planning section, or use the Search Reports box to locate the correct report.
This will load the report in a new tab:
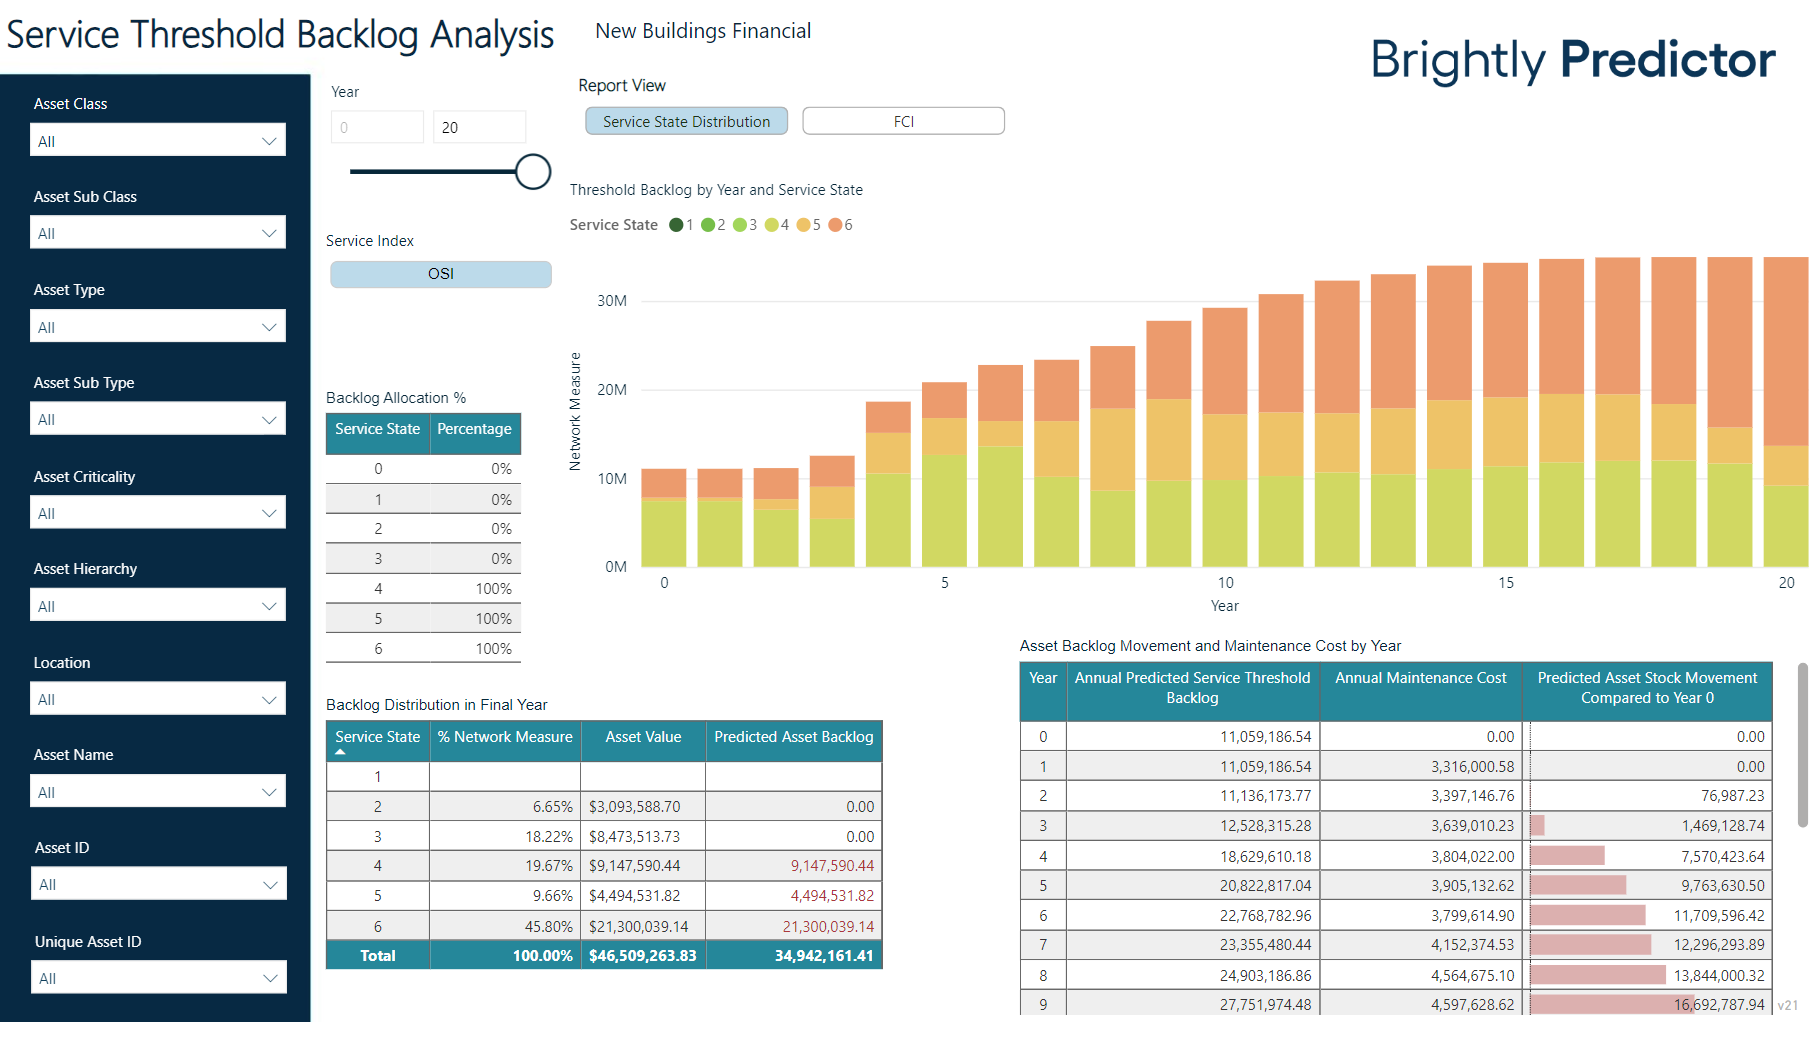
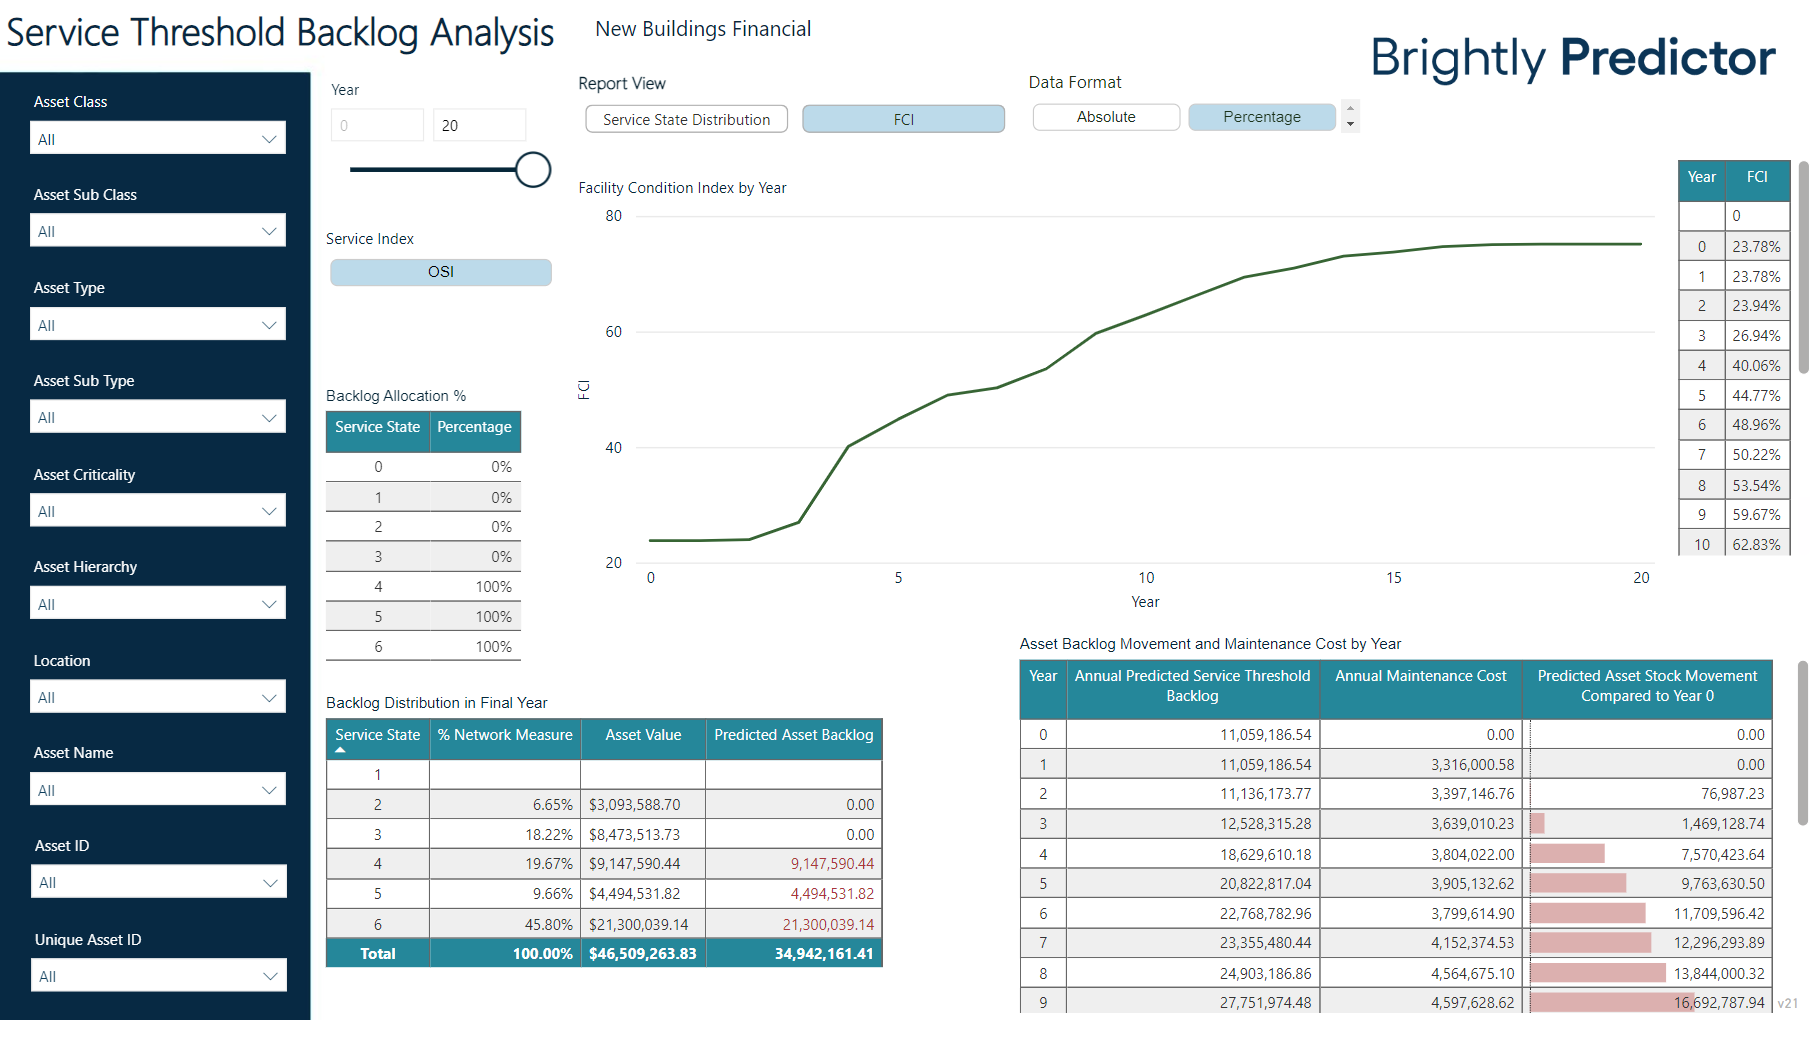
Users will now be able to switch between Service State Distribution and FCI (Facility Condition Index) view.
Note: The FCI view will only be enabled if users have provided the Asset Value optional mapping during the import process. It would also be advisable to provide the Location optional mapping for filtering and reporting purposes.