Risk Analysis Report
Objective: Gain an understanding of the Risk Analysis report.
This report allows an organisation to analyze the predicted risk behavior of their asset portfolio as a result of the financial strategy chosen in their Simulation.
Under ISO 31010:2009, Predictor utilises the consequence versus probability matrix to perform risk assessments and therefore the following reports reflect this framework.
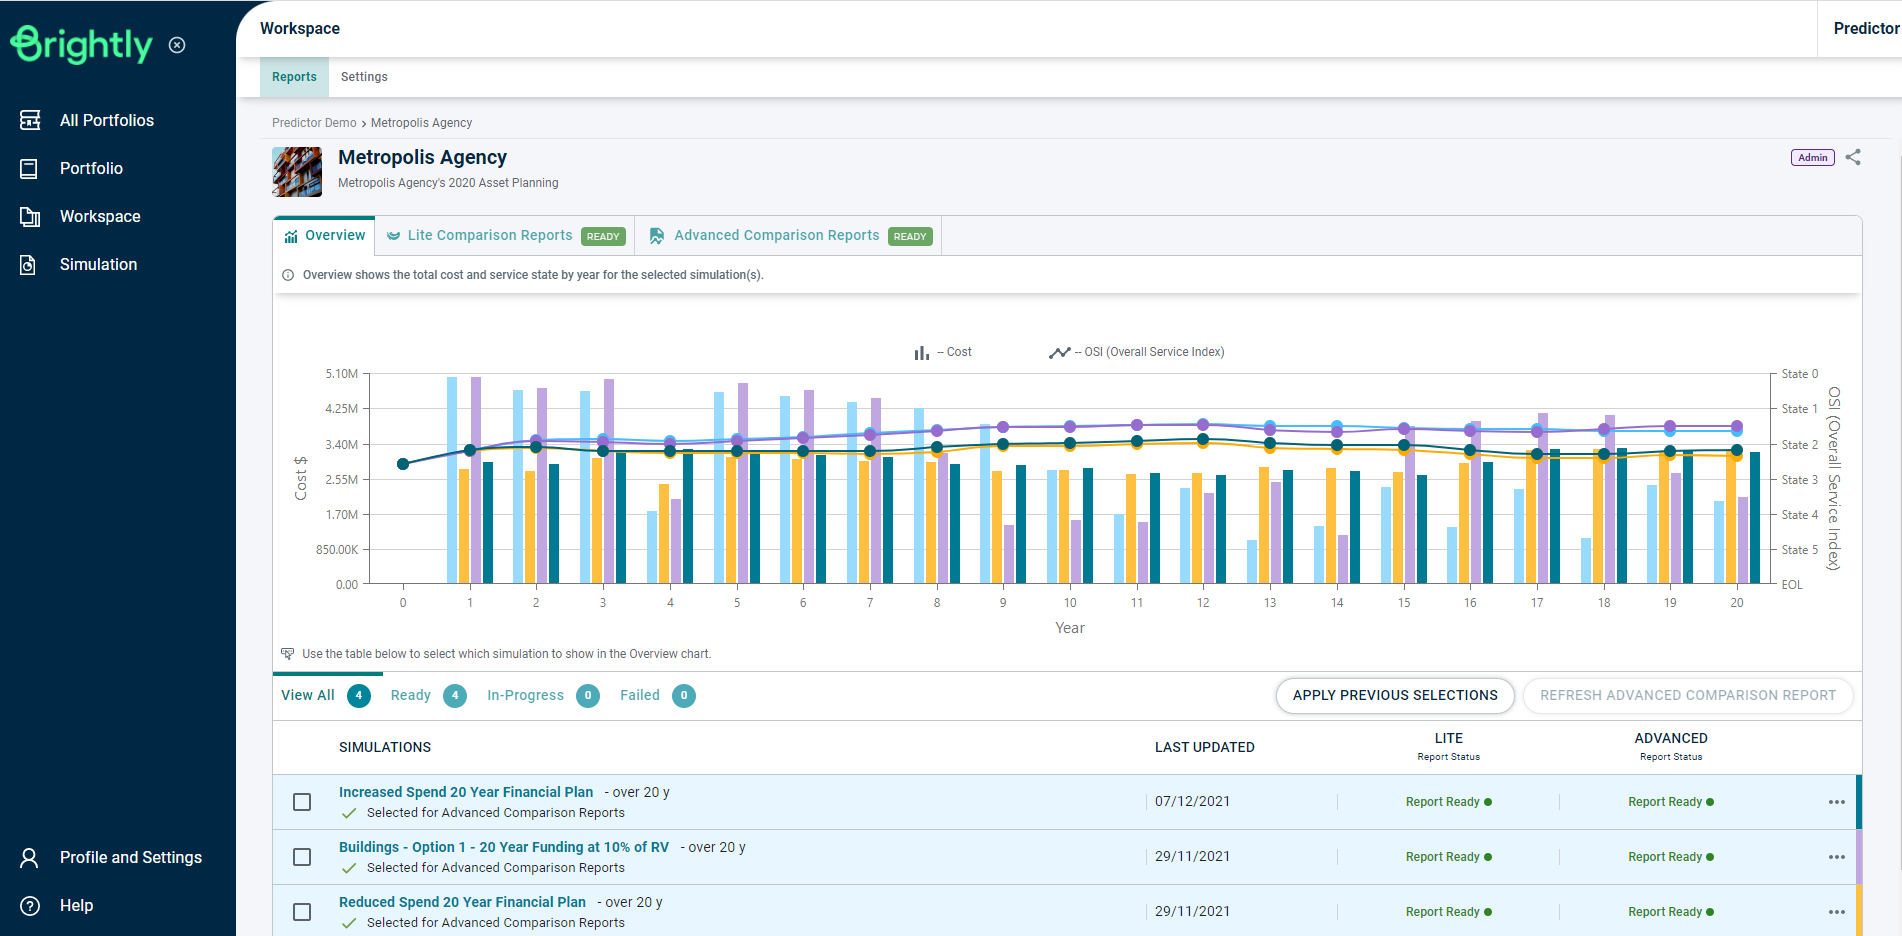
To load the Risk Analysis report in the Brightly Predictor Web App, users log in with their Predictor account, and select the Simulation from within their Workspace.
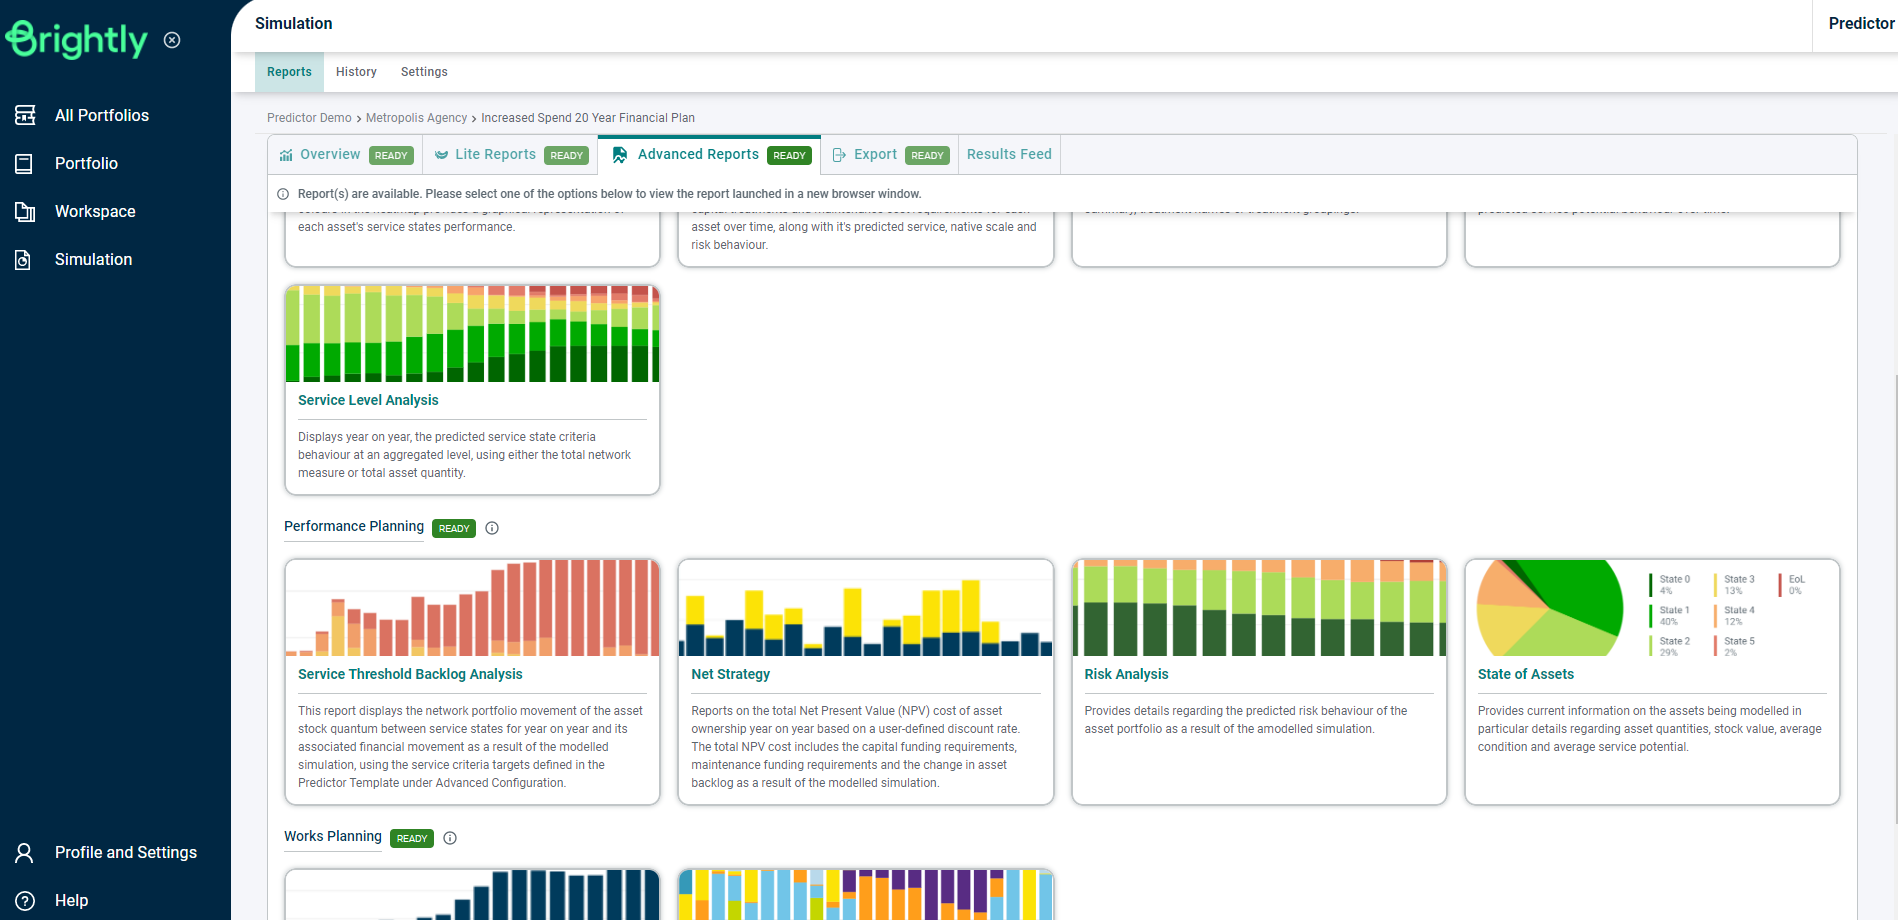
Once the Simulation is loaded, users can click on the 'Risk Analysis' report in the Advanced Reports tab, under the Performance Planning section, or use the Search Reports box to locate the correct report.
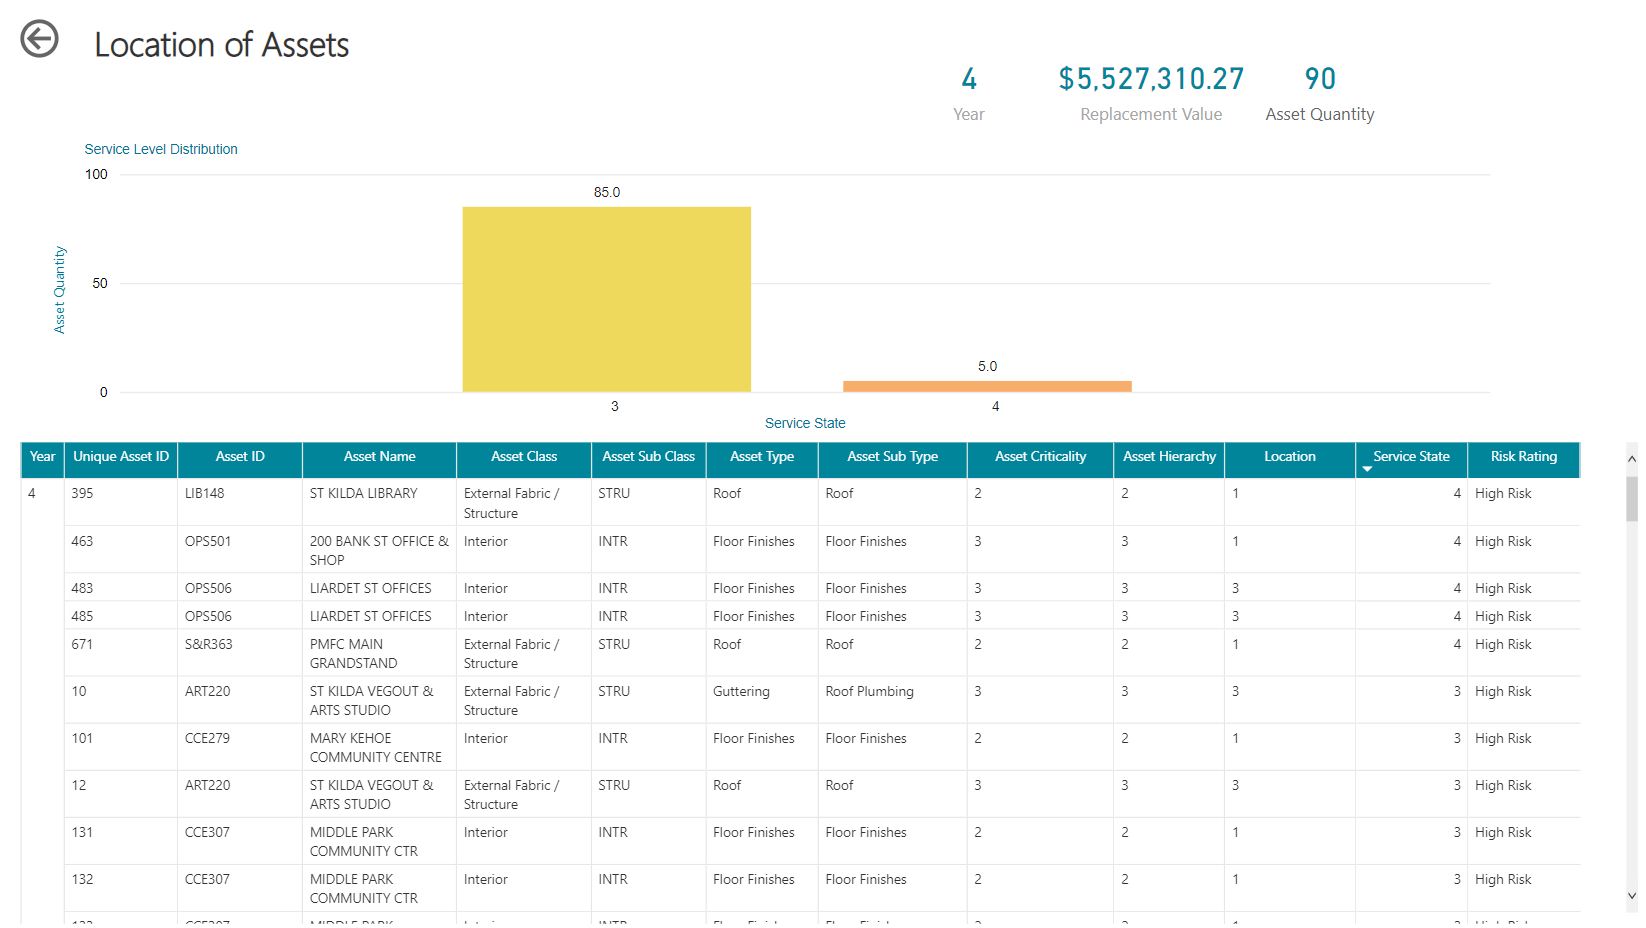
This report allows users to view the asset quantity, asset value, and network measure for each Risk Rating Label, as configured in the Advanced Setup section, and can be filtered by the Risk Rating label.
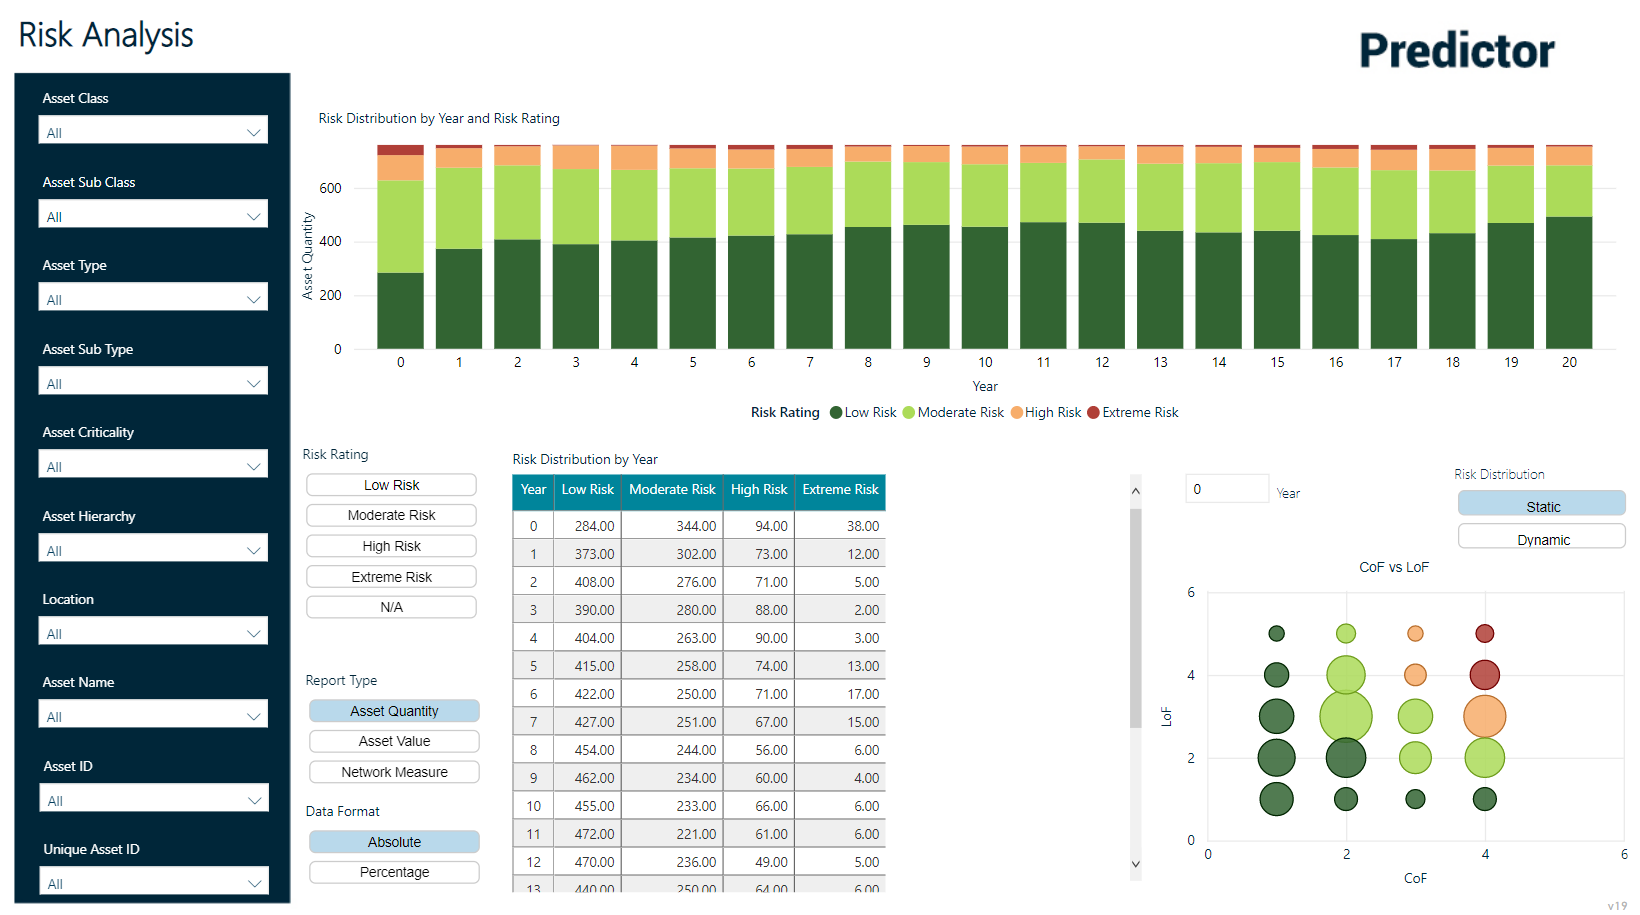
The report also contains a bubble chart that displays the three parameter outputs for each year of the Financial Strategy, with the Likelihood of Failure on the Y-axis, Consequence of Failure on the X-axis, and the Asset Quantity, Value, or Network Measure of each Risk Rating Label represented by the size of the bubble. This can be toggled between a static display, which will always show axes of 0 to 6, or dynamic, which will scale the axes to the bubbles that are present.
Users can further interrogate the Risk Analysis using the 'Drill Through' feature by right-clicking:
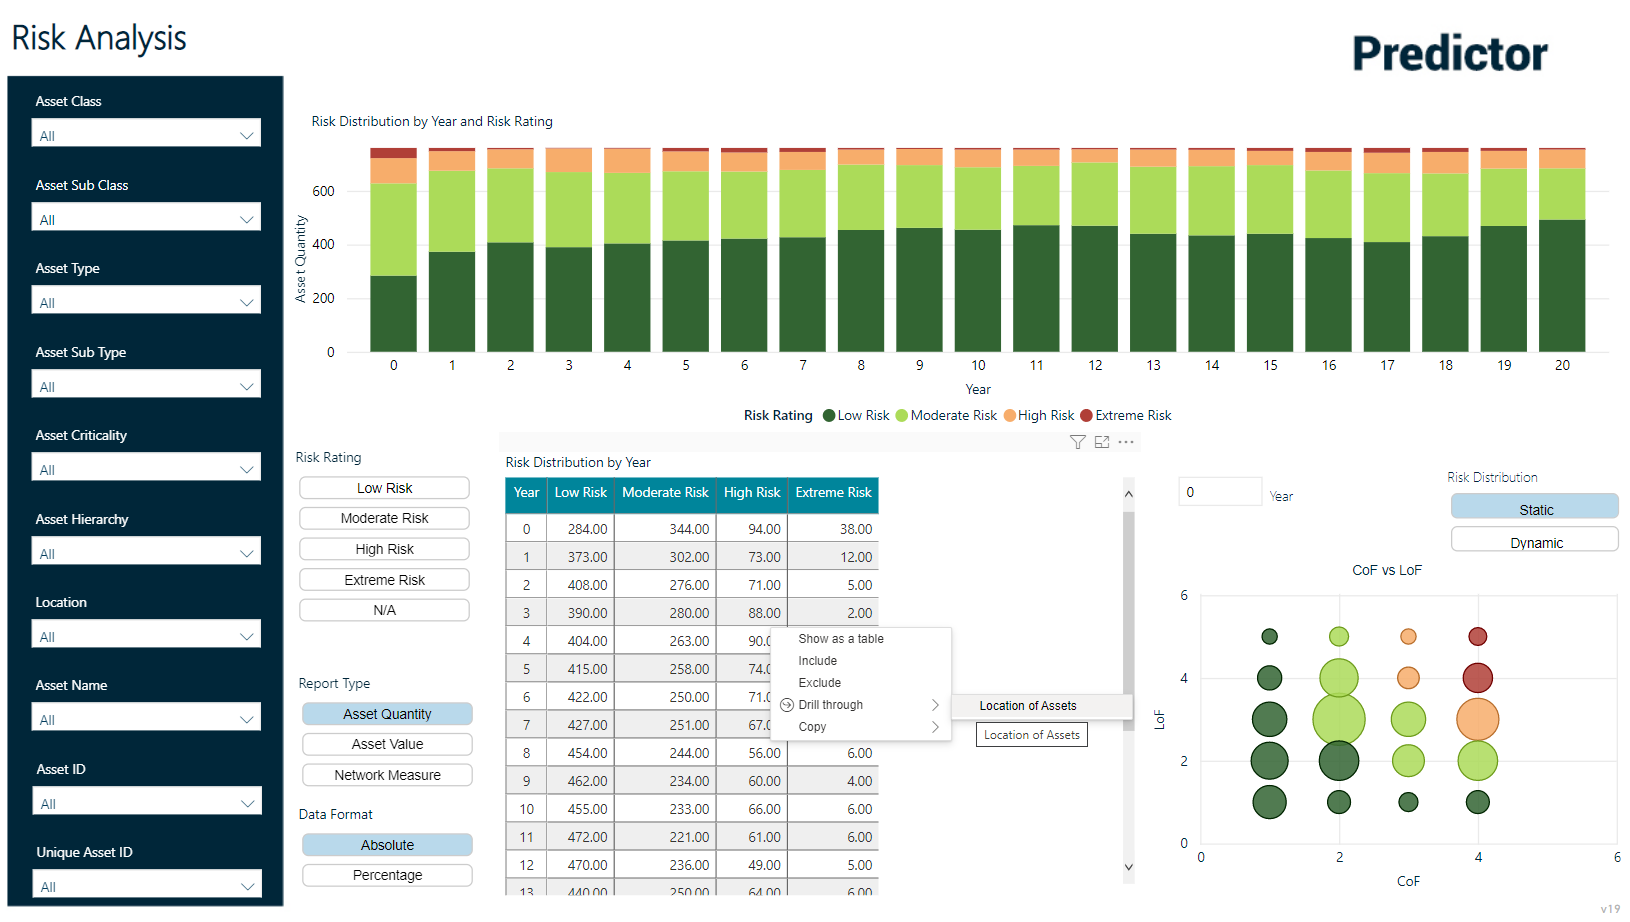
This will provide a breakdown of the Risk by Location: