Net Strategy Comparison Report
Objective: Gain an understanding of the Net Strategy Comparison report
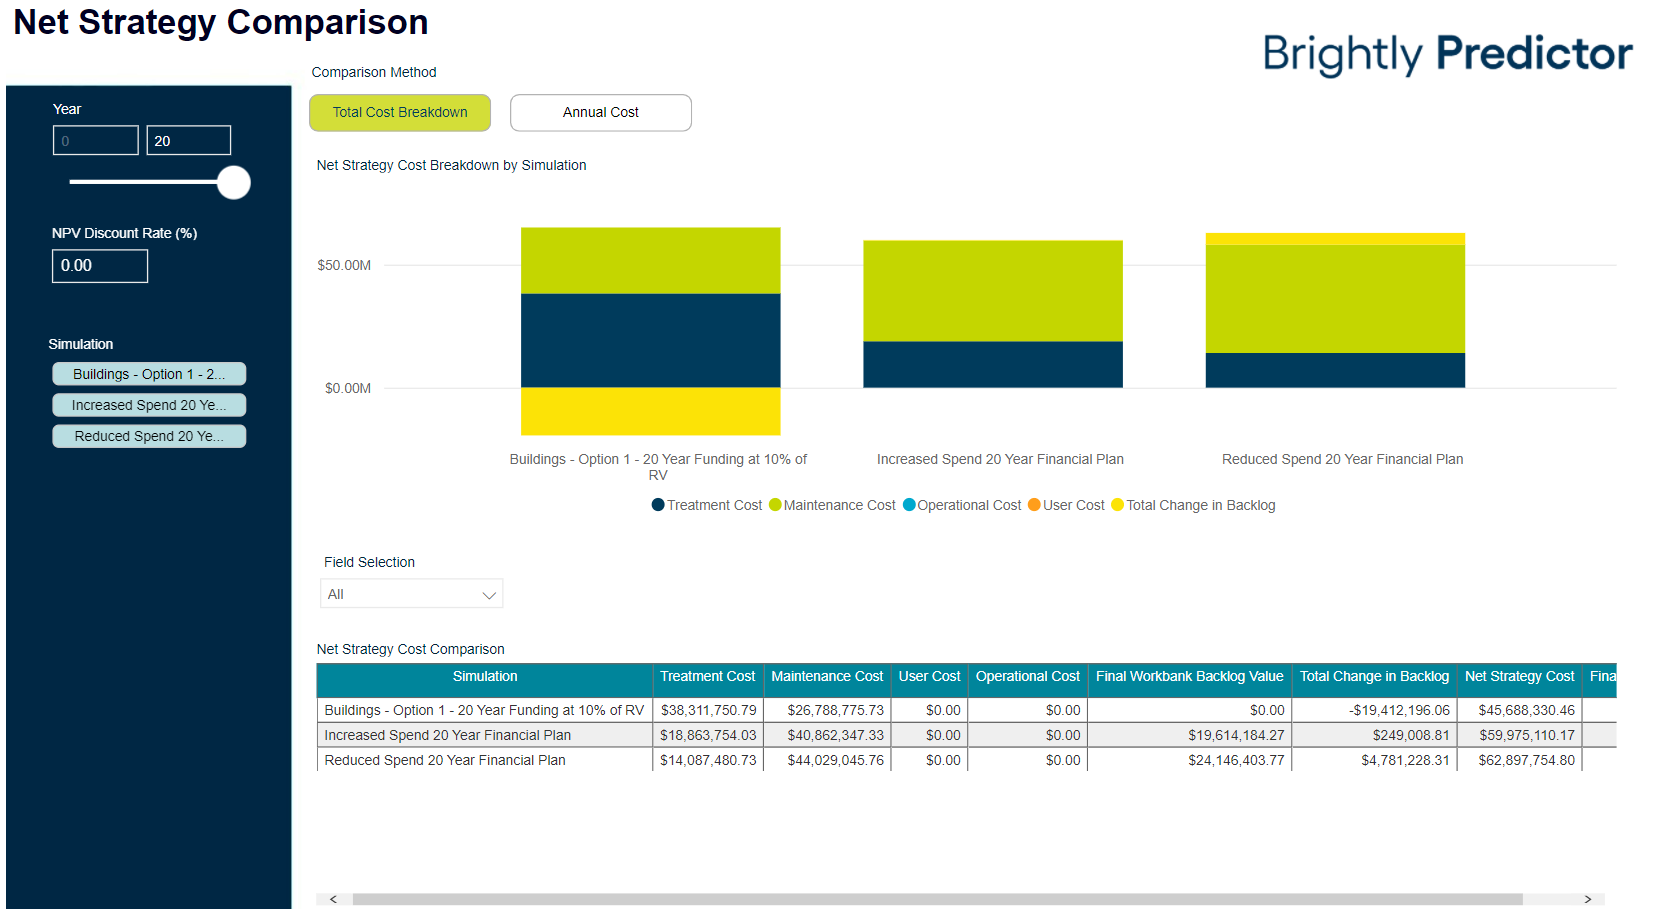
The Backlog Comparison report directly compares the total Net Prevent Value (NPV) cost of asset ownership for each selected Simulation.
Once the Workspace is loaded, users can click on the 'Advanced Comparison' tab to view the Advanced Reports.
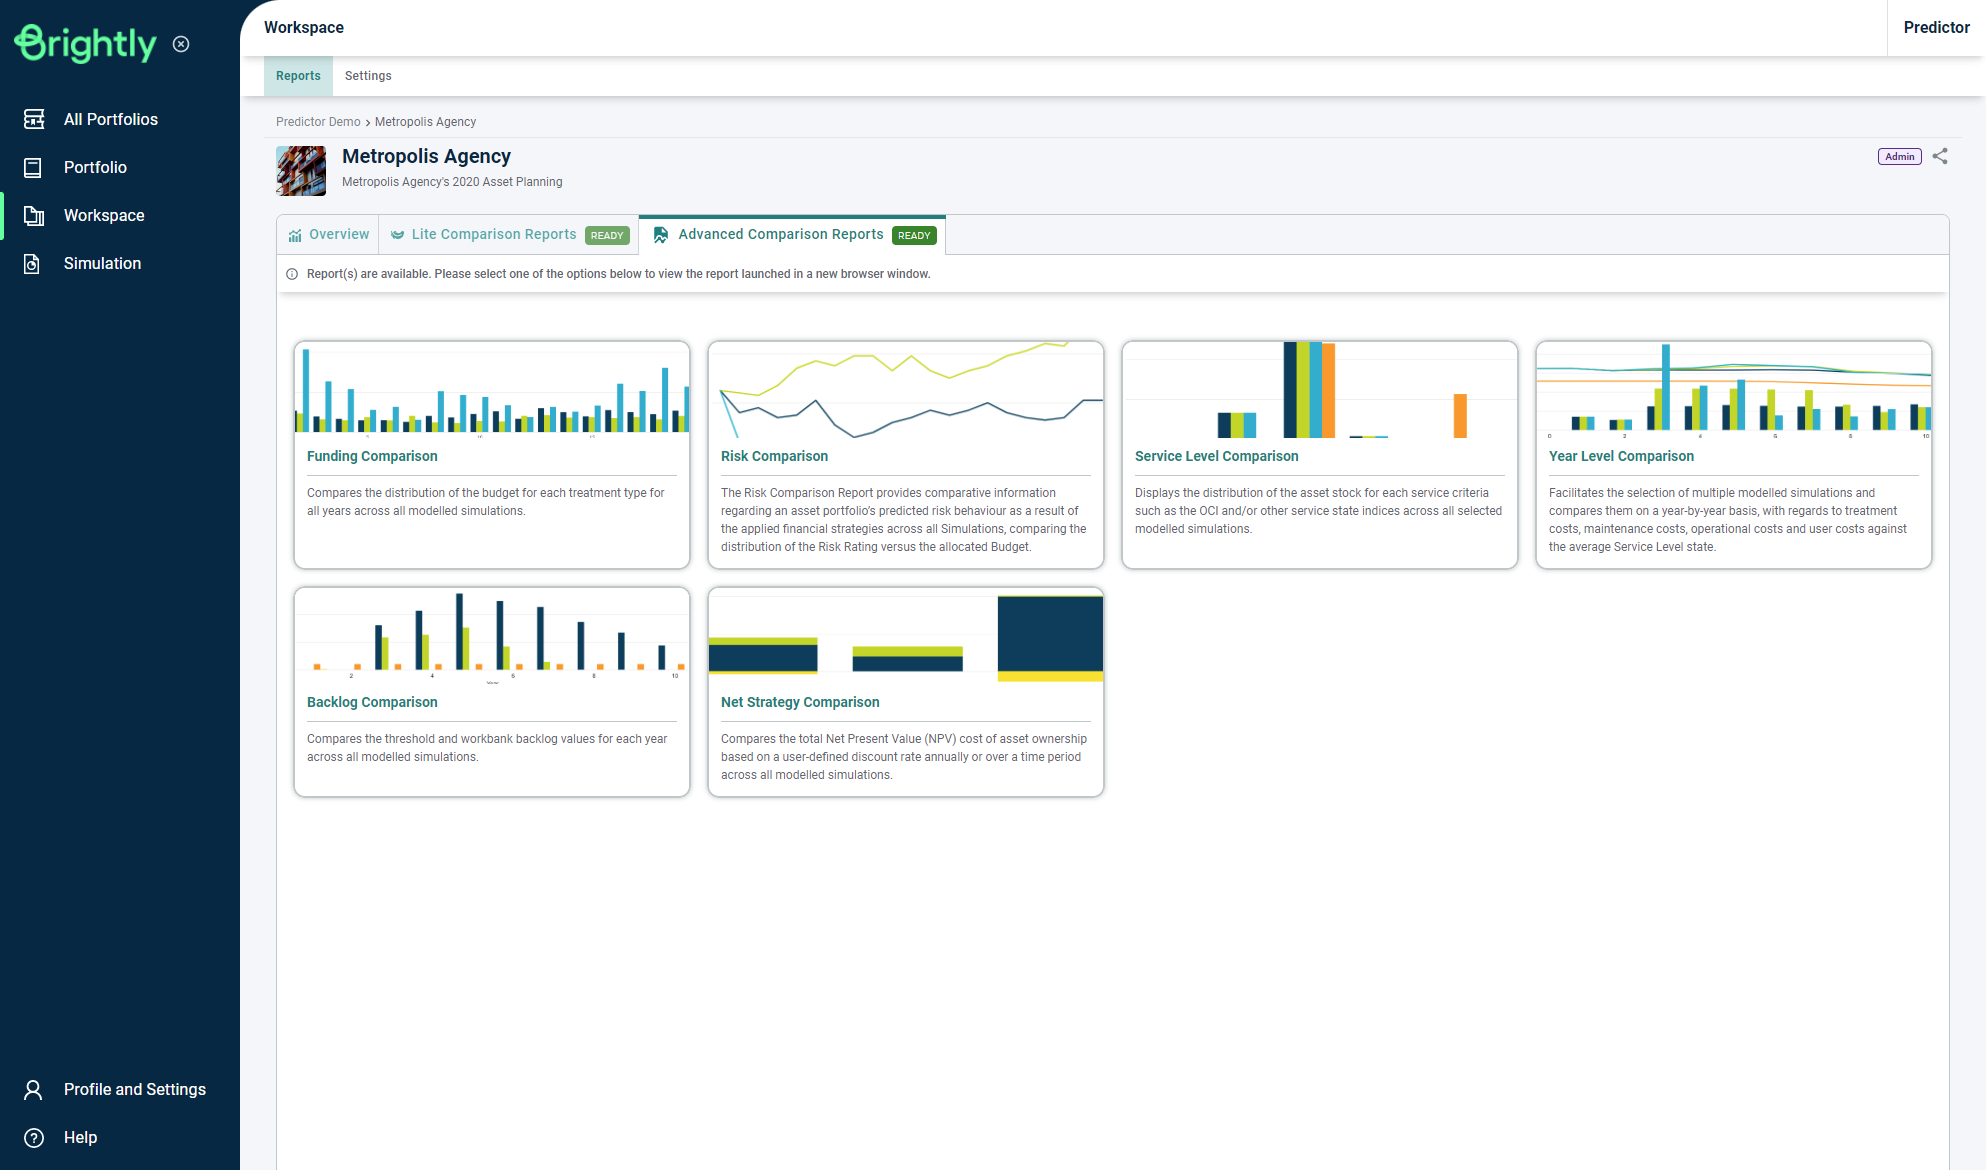
Users can click on the 'Net Strategy Comparison' button to load report in a new browser tab. Once loaded, on the left users can select a year range, input a NPV discount rate, and select the Simulations to include in the comparison.