Year Level Comparison
The Year Level Comparison report is one of a number of reports available as a Sample Run in the Desktop App, which is run using a randomly selected 100 Assets, in order to verify and validate a Model's configuration.
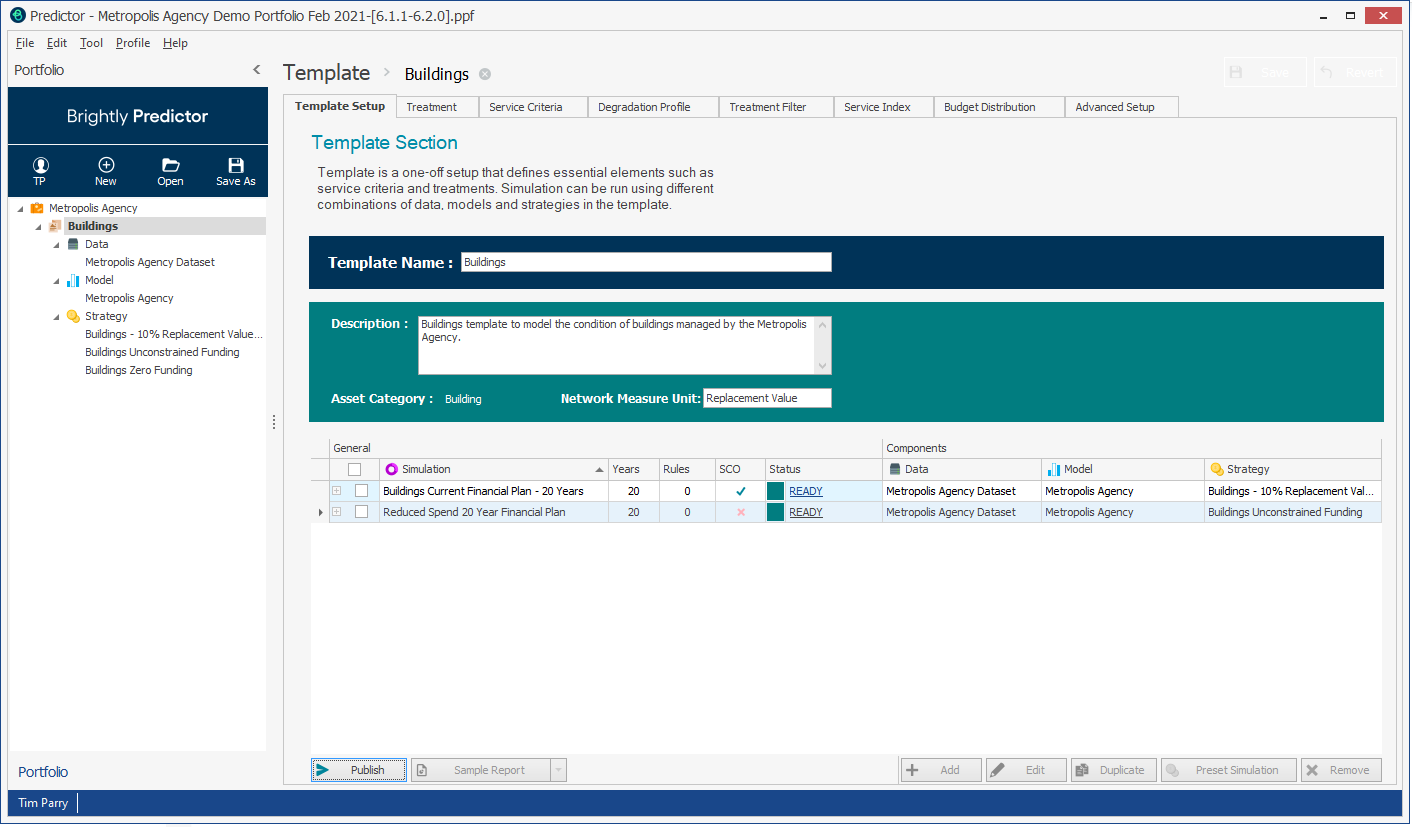
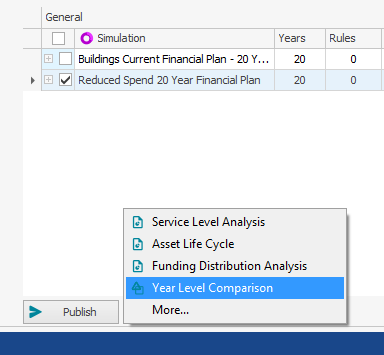
Users then select the Year Level Comparison option from the Sample Report arrow to launch the Report Viewer.
Select the simulations and then click on View Report.
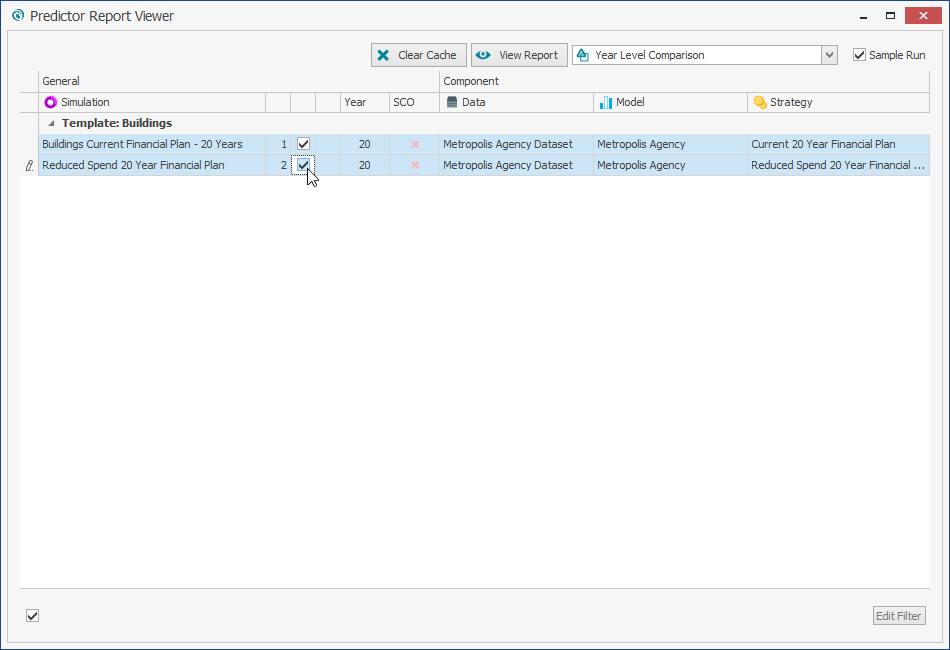
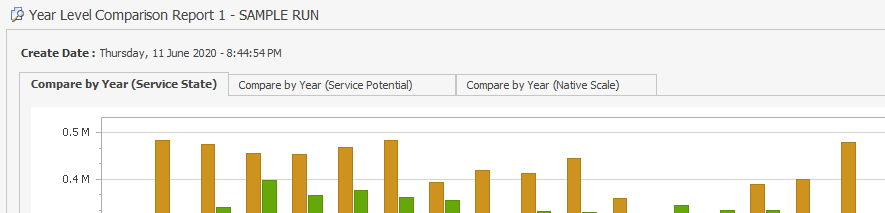
A sample run of the Year Level Comparison report is generated.
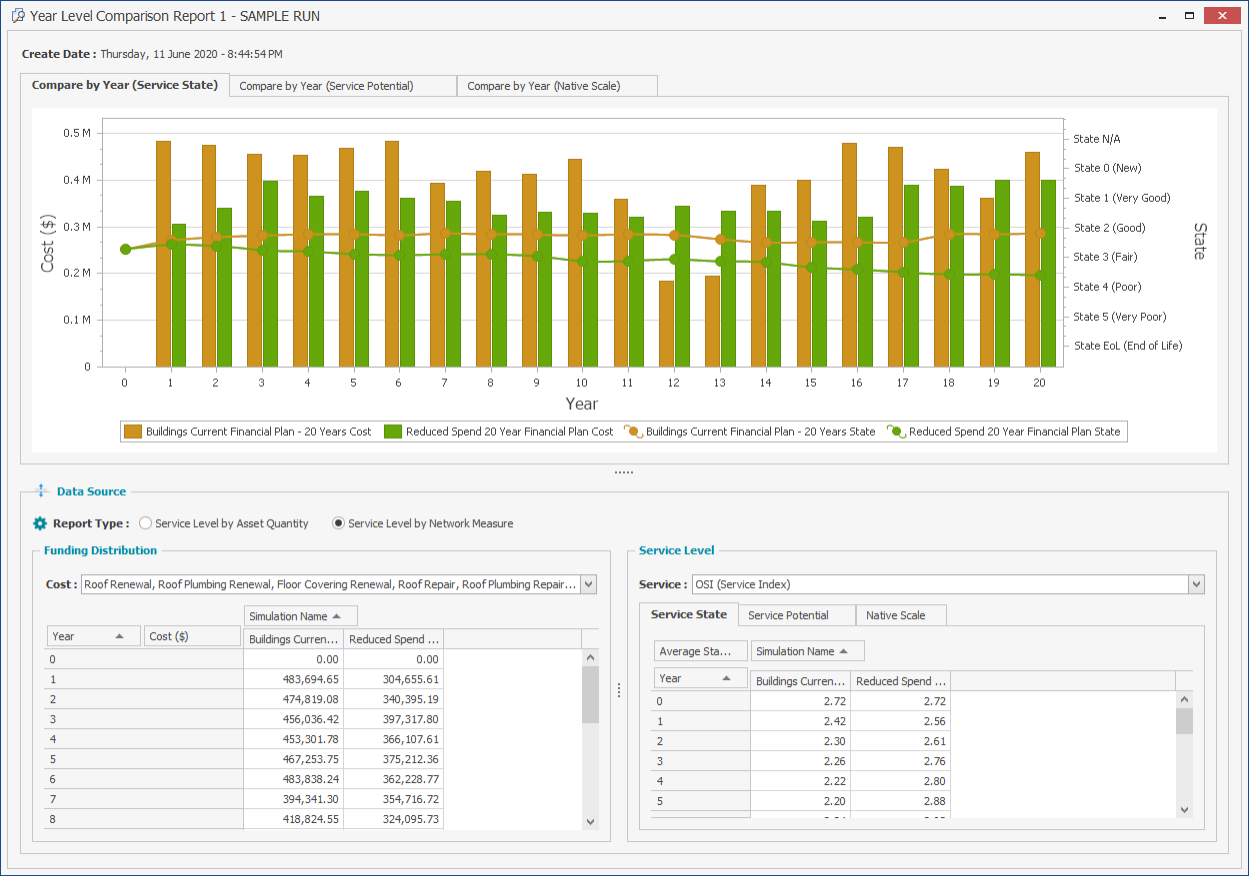
Users will be able to view different Service Scaling Methods from the tabs at the top and Report Types from the options in the Data Source box.
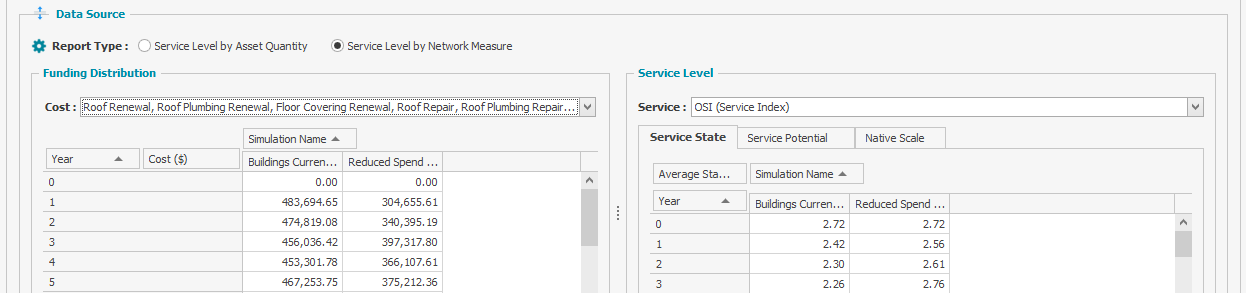
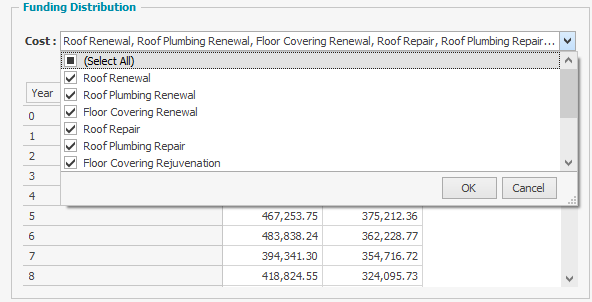
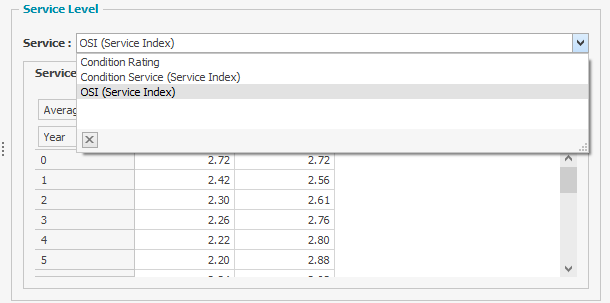
To view different Cost Types for Funding Distribution and Service Criteria, users can select different options from their respective drop-downs.
This sample run report allows users to identify and resolve any issues with their Model, before they publish full simulation results to the Web App, where the full version of the Asset Life Cycle report can be viewed.
