Service Level Comparison
The Service Level Comparison report is one of a number of reports available as a Sample Run in the Desktop App, which is run using a randomly selected 100 Assets, in order to verify and validate a Model's configuration.
This report displays the distribution of the asset stock across the service criteria ranges for each Service as well as the OSI and any other custom Service Indices for selected simulations.
Here, users can select an available simulation, and then click the Sample Report button 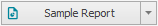 to launch the Report Viewer window.
Select the Service Level Comparison report from the drop-down menu of the report viewer window:
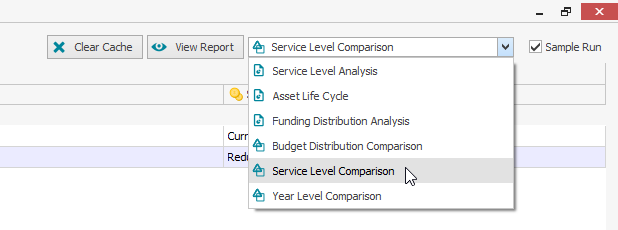
Select the simulation you wish to compare using the available checkboxes, and then select View Report:
The following screen will appear:
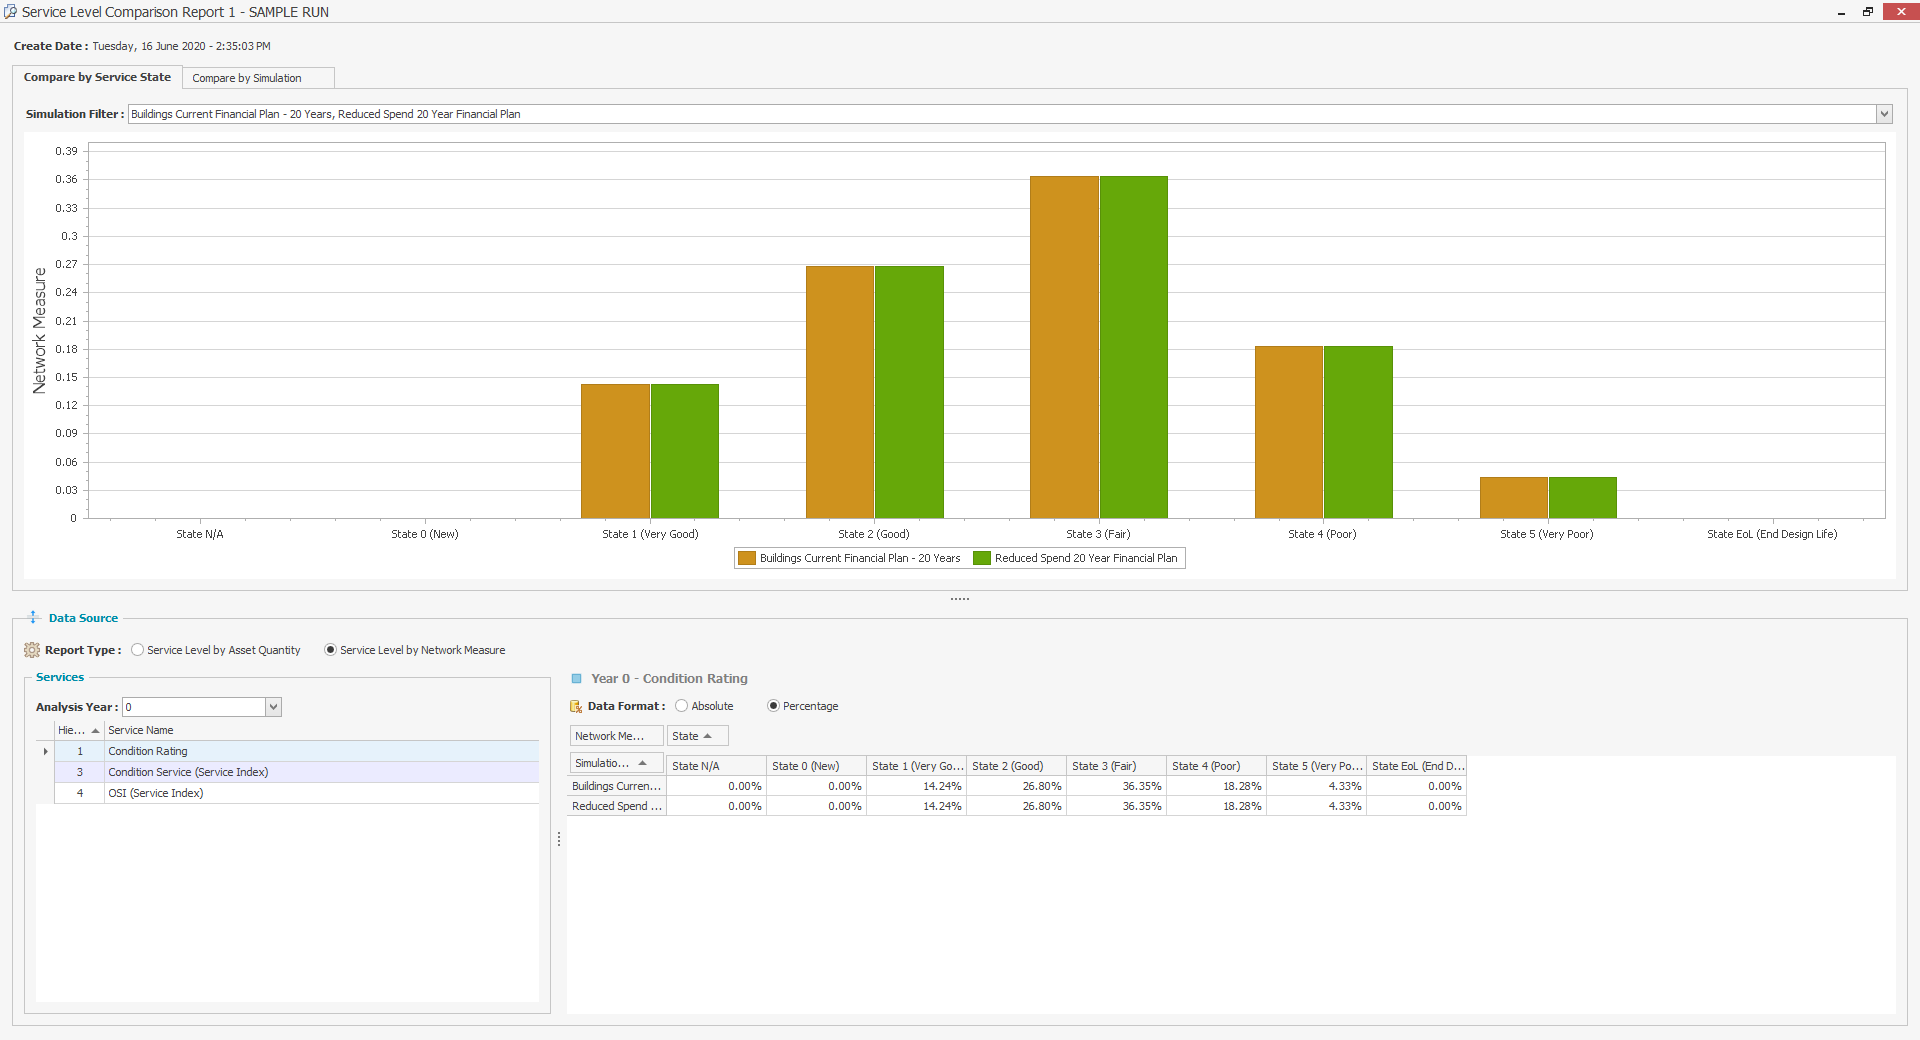
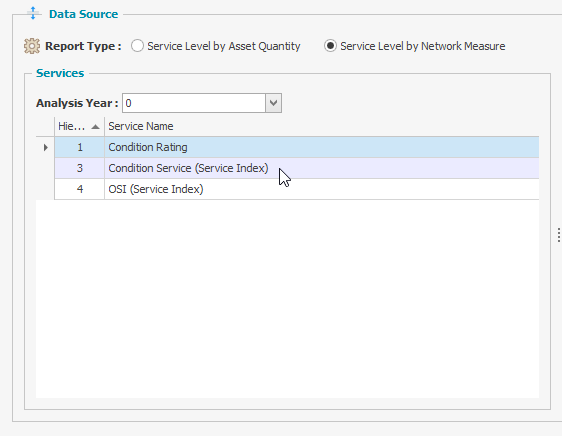
To compare using other available condition indices, select an alternative option from the Data Source section of the report.
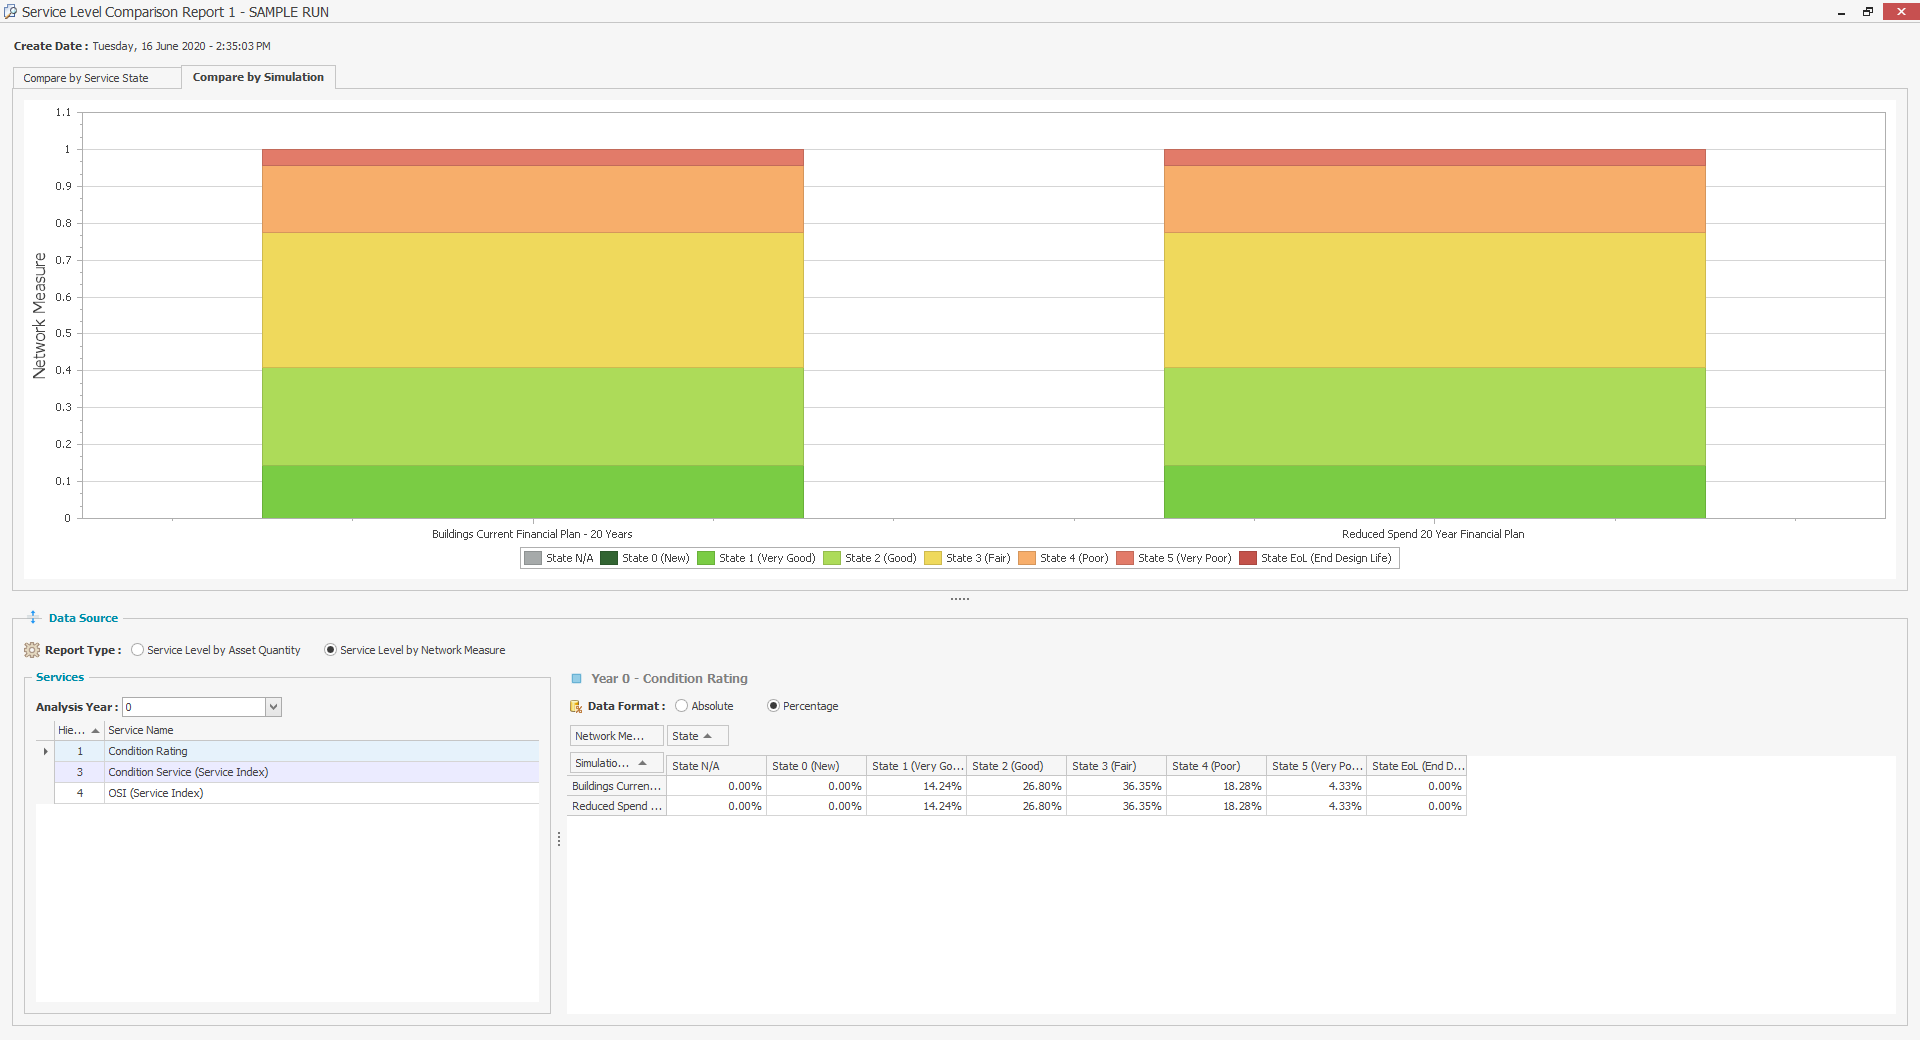
This report can also be viewed using the 'Compare by Simulation' tab to compare the simulations side by side:
This sample run report allows users to identify and resolve any issues with their Model, before they publish full simulation results to the Web App, where the full version of the Asset Life Cycle report can be viewed.
