Budget Distribution Comparison
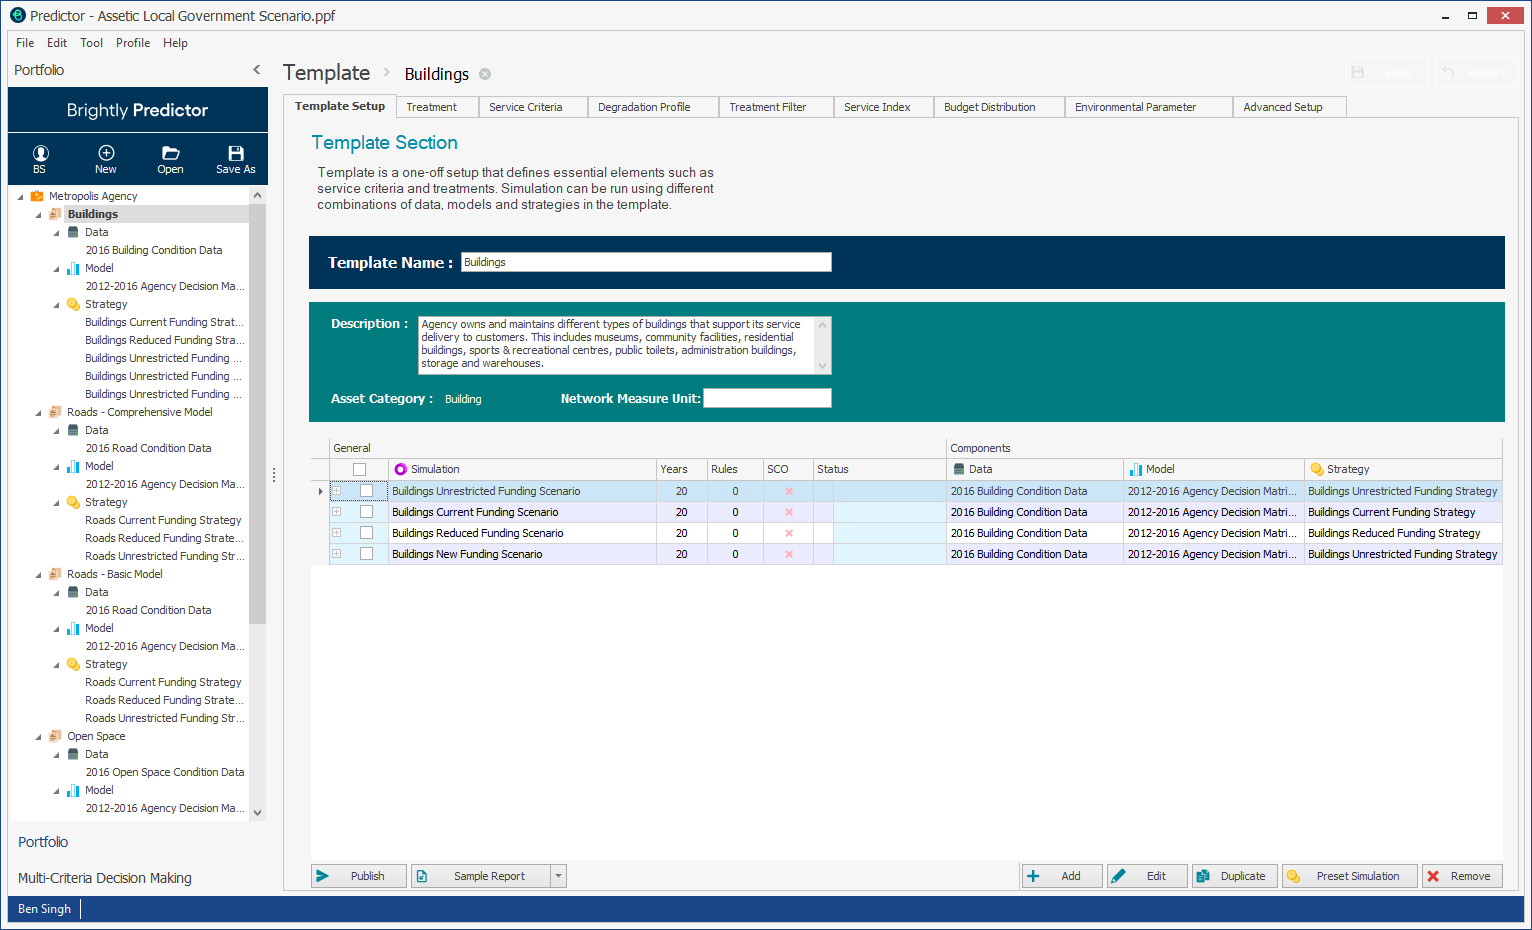
The Service Level Comparison report is one of a number of reports available as a Sample Run in the Desktop App, which is run using a randomly selected 100 Assets, in order to verify and validate a Model's configuration.
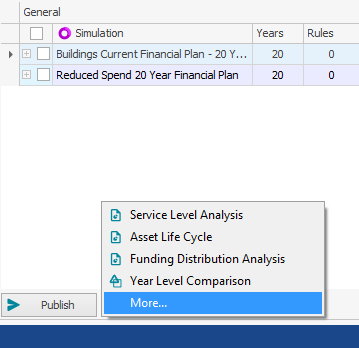
Users then select the More... option from the Sample Report arrow to launch the Report Viewer.
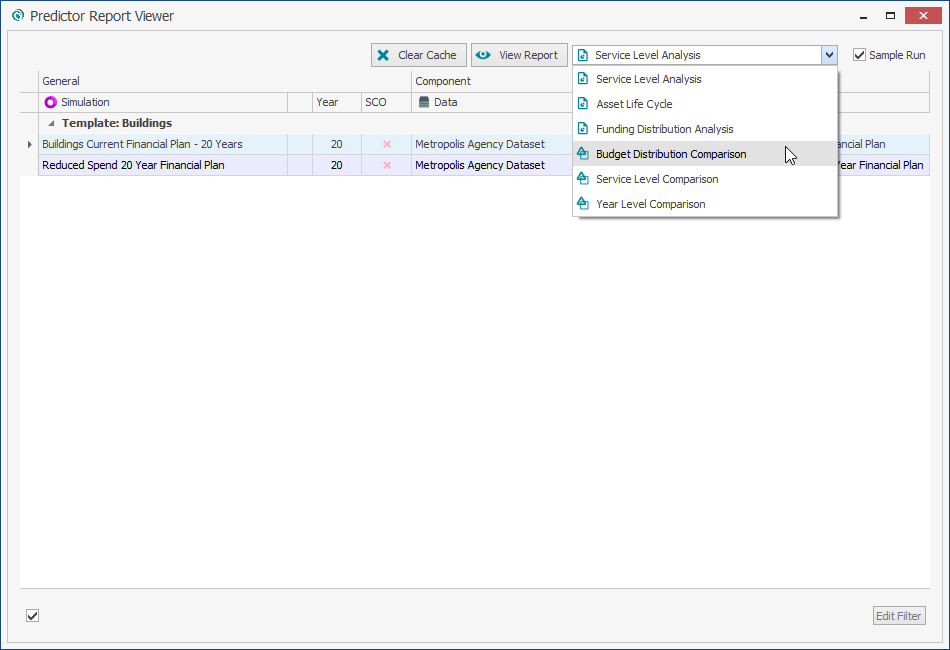
Select Budget Distribution Comparison from the drop-down menu.
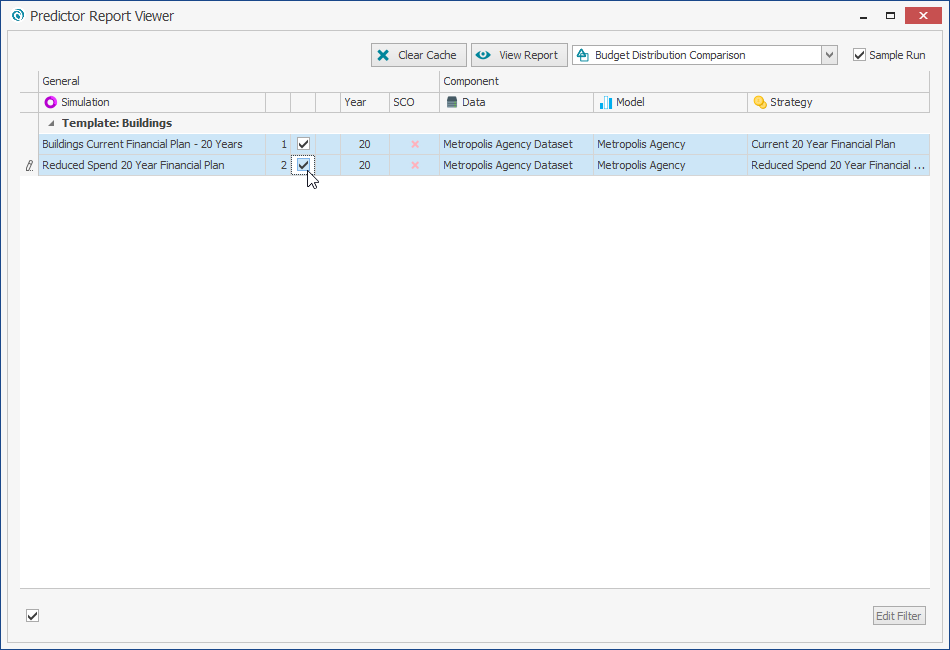
Select the simulations to compare and then click on View Report.
A sample run of the Budget Distribution Comparison report is displayed. Users will be able to view the different number of years and their predicted values. To do so, change the "Analysis Year" to any value in the Data Source window.
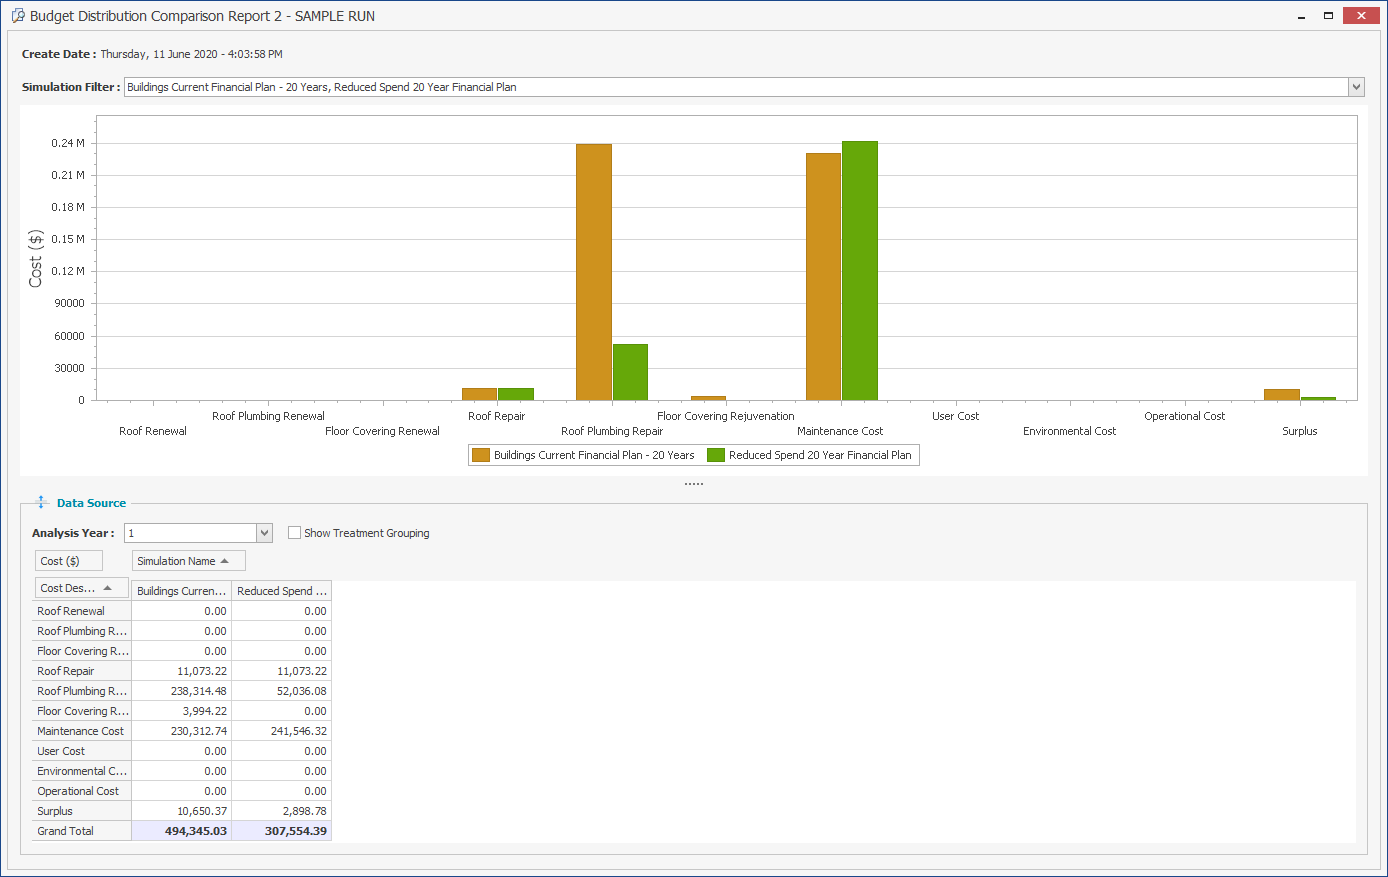
This sample run report allows users to identify and resolve any issues with their Model, before they publish full simulation results to the Web App, where the full version of the Asset Life Cycle report can be viewed.
