Asset Life Cycle
Objective: Gain an understanding of the Asset Life Cycle sample run report
The Asset Life Cycle report is one of a number of reports available as a Sample Run in the Desktop App, which is run using a randomly selected 100 Assets, in order to verify and validate a Model's configuration.
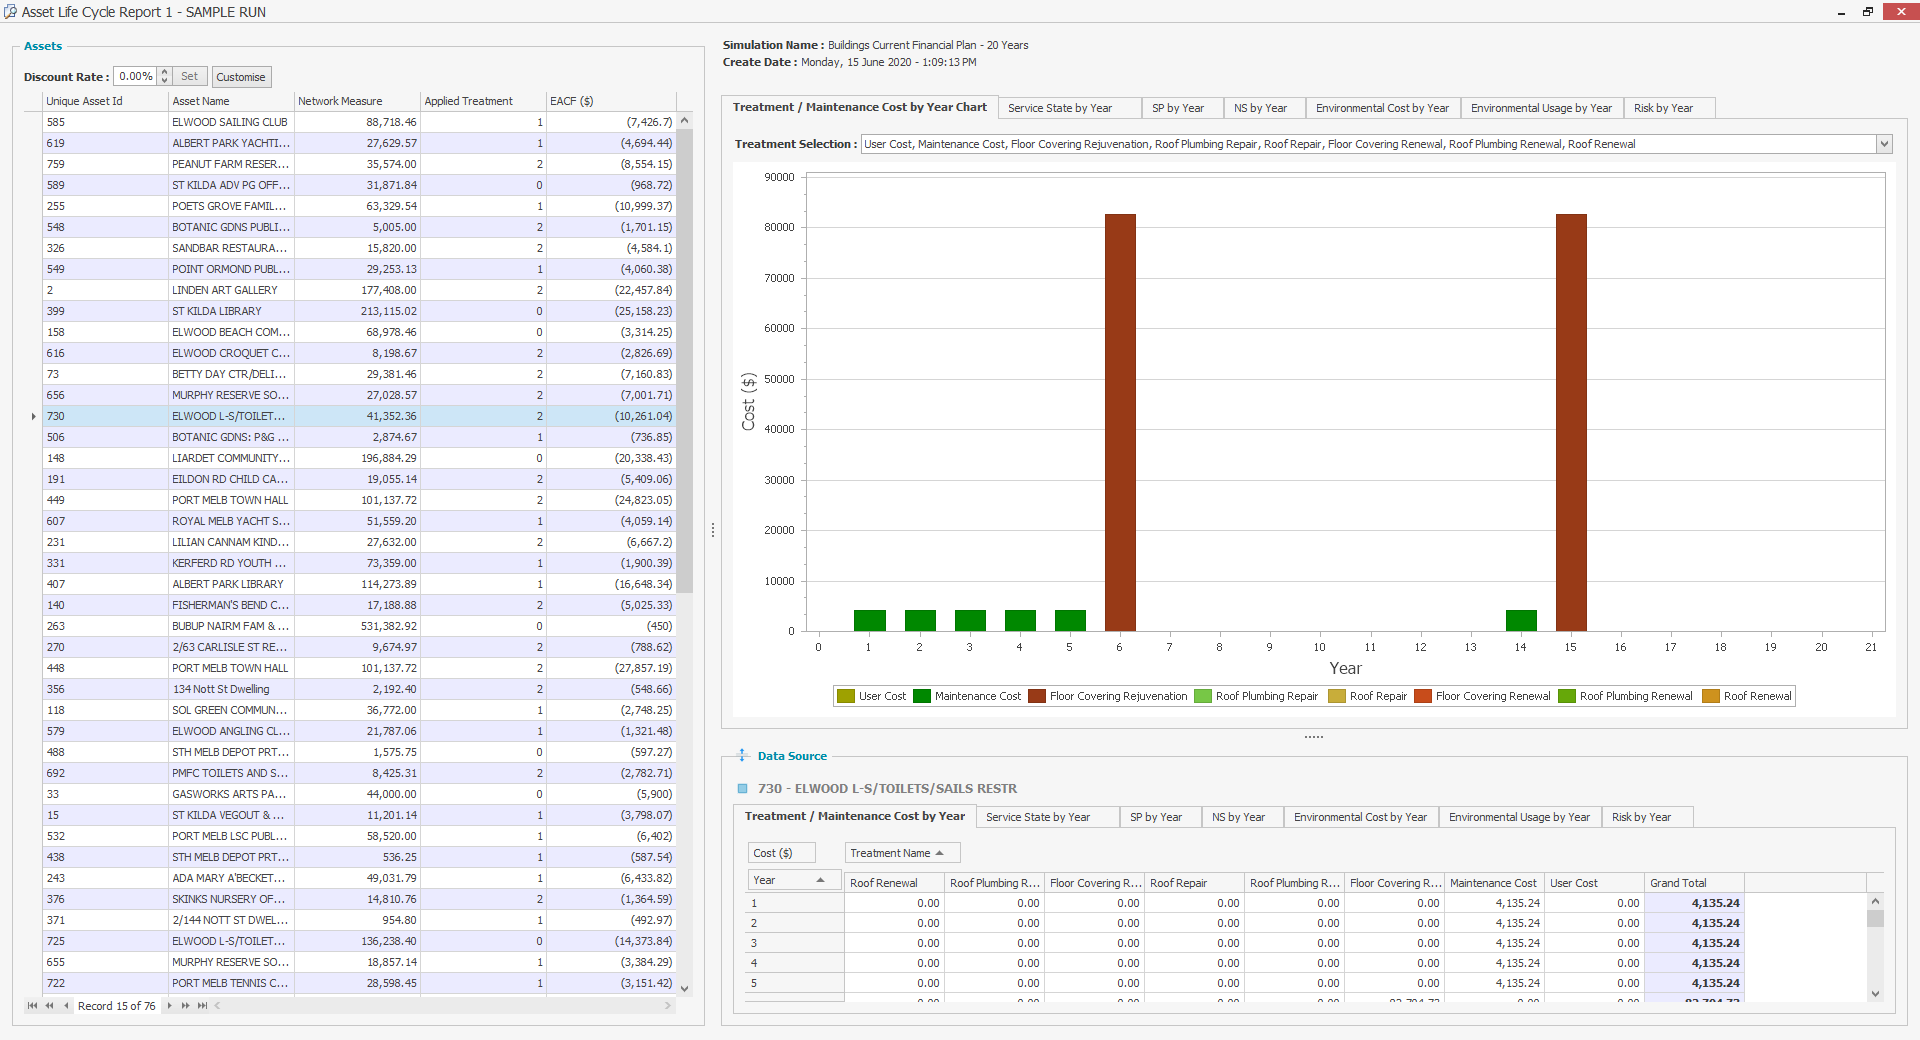
The Asset Life Cycle report displays each asset in a list, together with its network measure. Selecting assets from this list will provide users with an overview of the selected capital treatments and maintenance cost requirements for each asset over time, along with it's predicted service, native scale and risk behaviour.
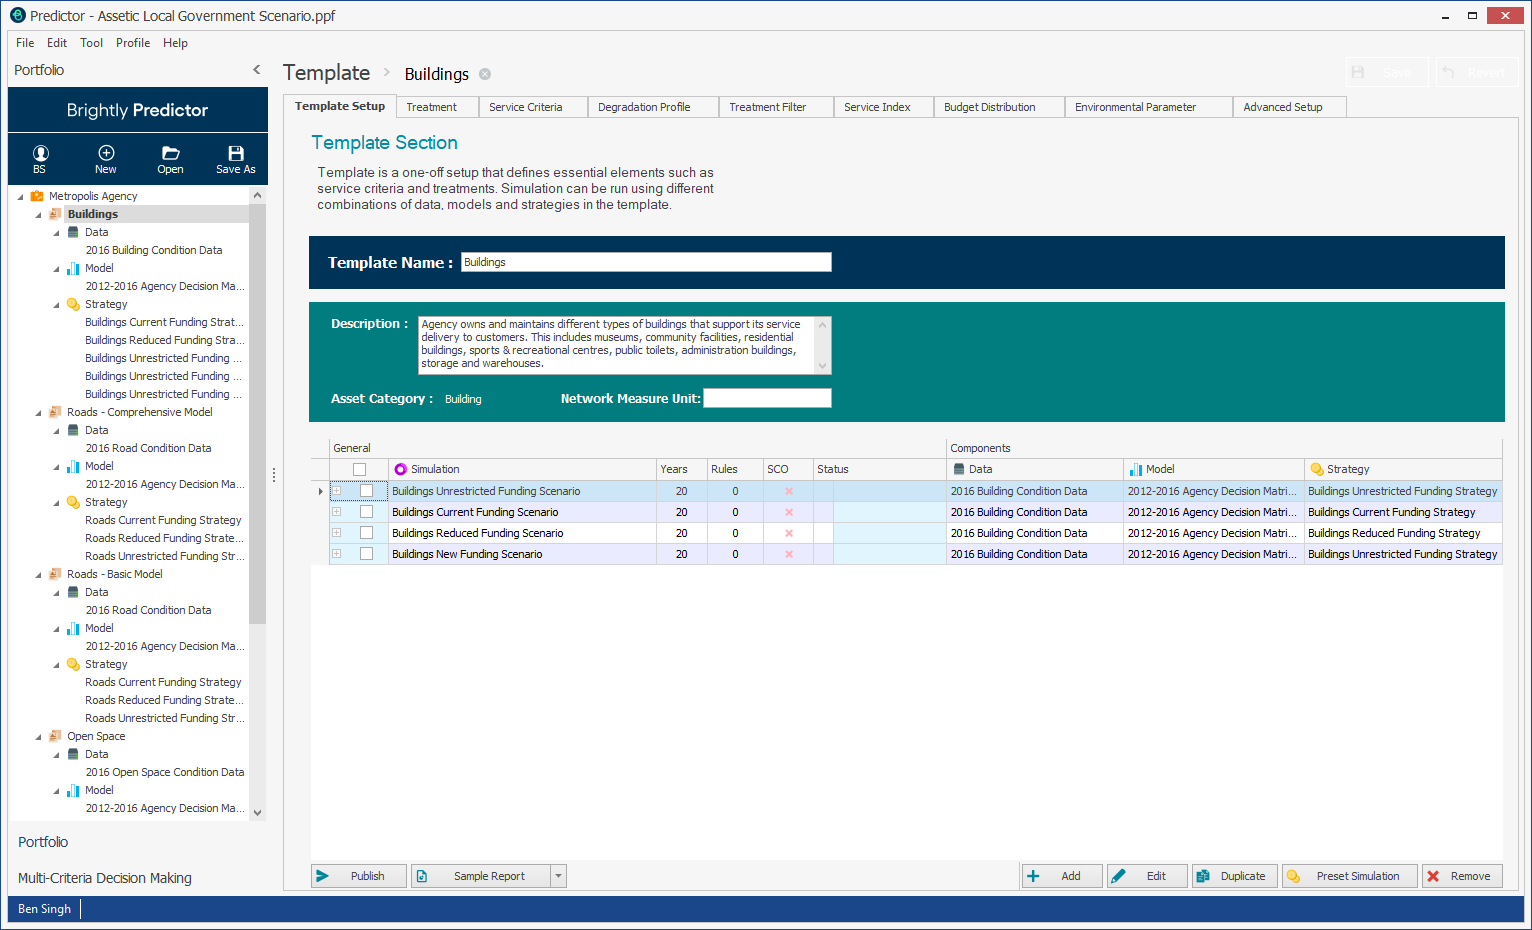
Here, users can select an available simulation, and then click the Sample Report button  to launch the Report Viewer window. Alternatively, the Asset Life Cycle report can be selected from the Sample Report drop-down arrow to launch the report itself immediately.
Predictor will then generate a sample run of the Asset Life Cycle report and a discount rate percentage can be set in the top left of this view.
Treatment / Maintenance Cost by Year Chart
The Treatment / Maintenance Cost by Year Chart tab provides a summary for each asset of Treatment Costs per year, grouped by the Treatment Name, and provides a cost value breakdown for each year of the simulation.
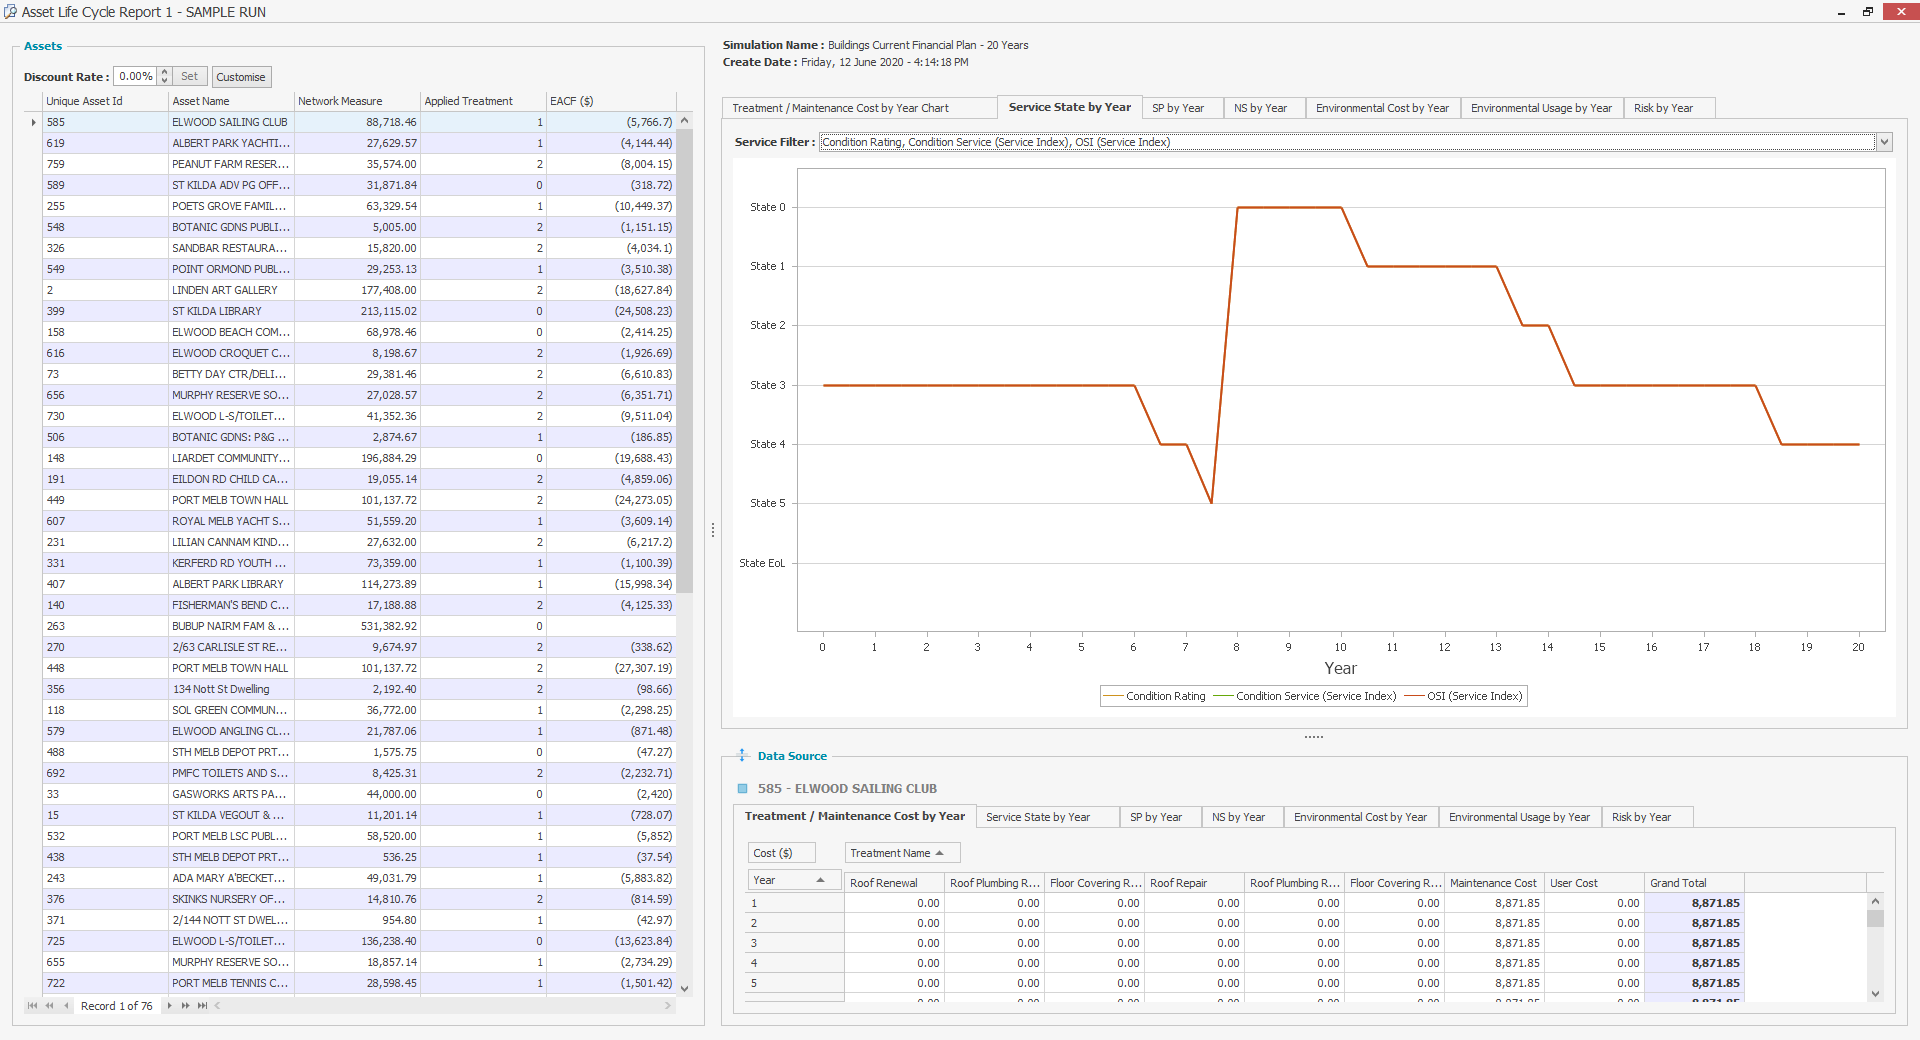
Service State by Year
Selecting the Service State by Year tab above the graph details how the service state of an asset degrades each year and also visualises how treatments performed as a result of the asset's degradation restores the service state to a higher level.
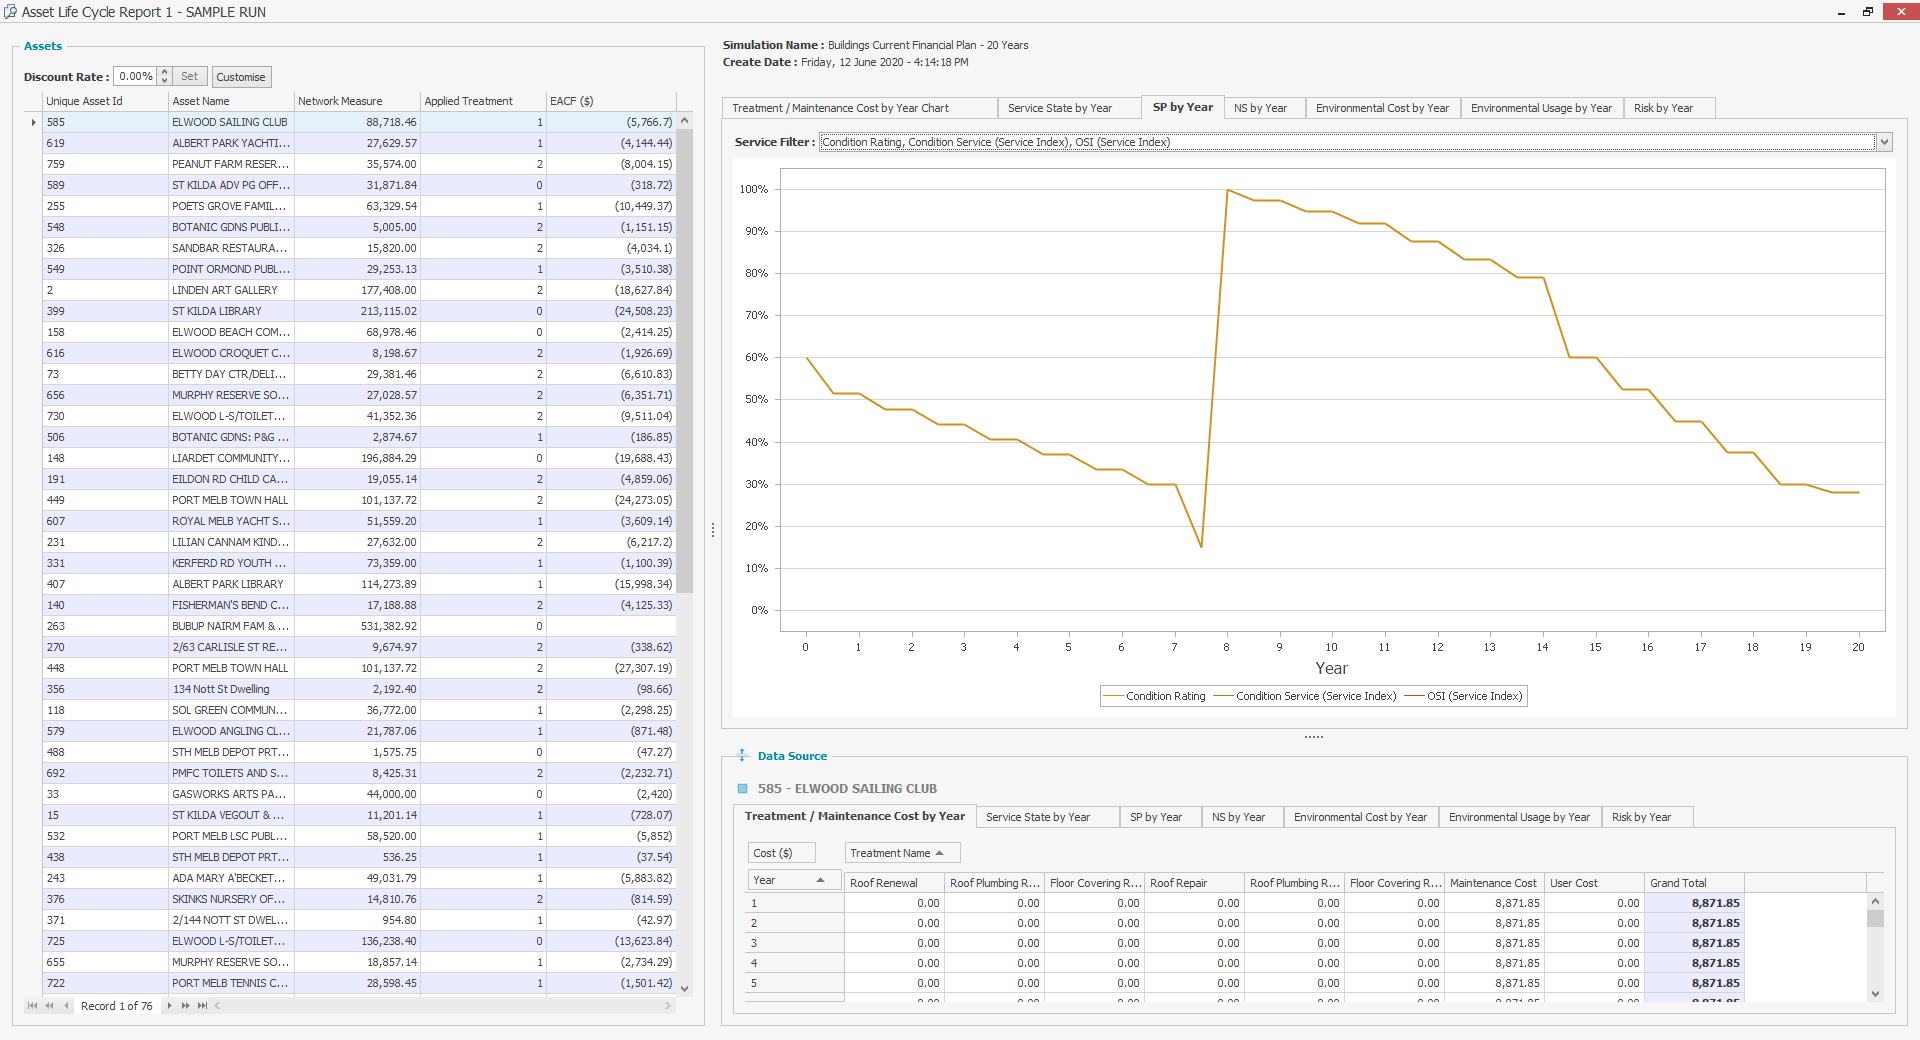
SP by Year
Selecting the Service Potential (SP) by Year tab will show how the service potential degrades each year and also displays how the Condition Rating is restored to a higher level by performing a treatment on the asset.
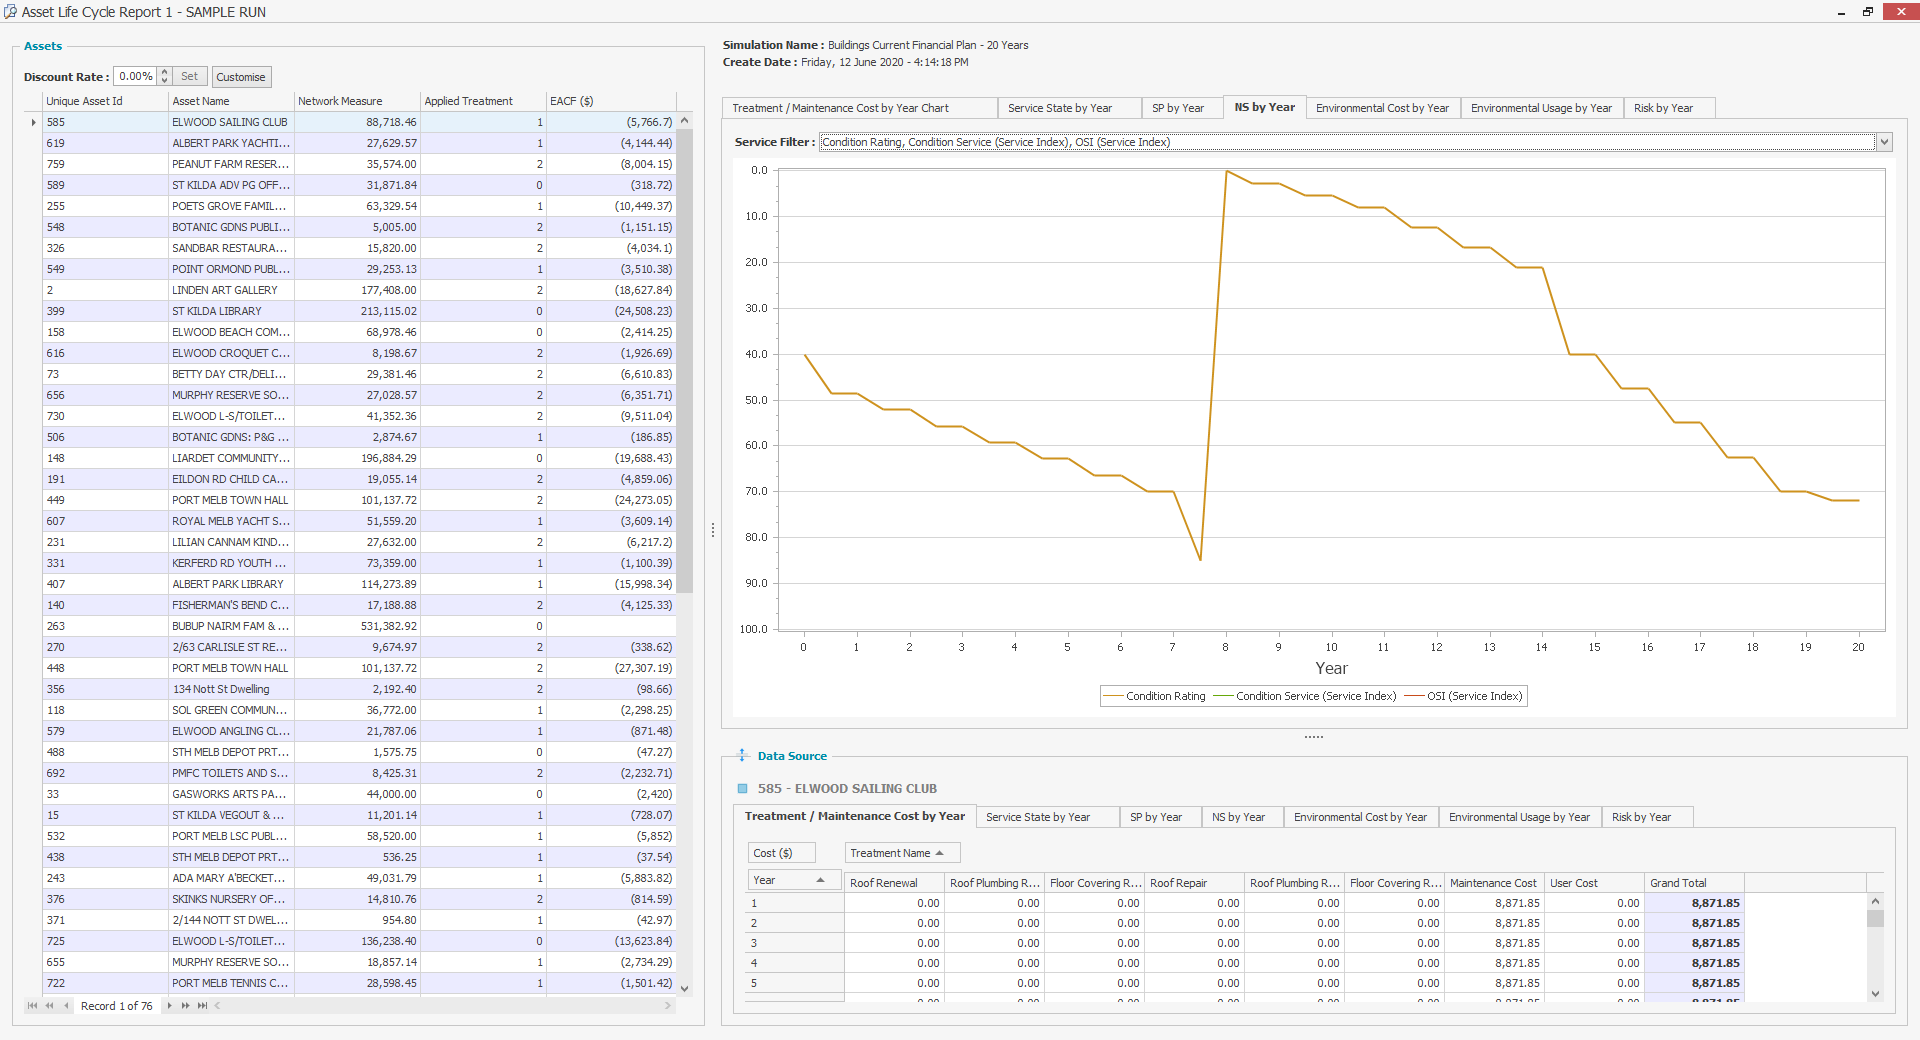
NS by Year
Selecting the Native Scale (NS) by Year tab will show how the service level degrades over time with a defined scale that is 'native' to an organization and also displays how the condition can be restored to a higher level by performing a treatment.
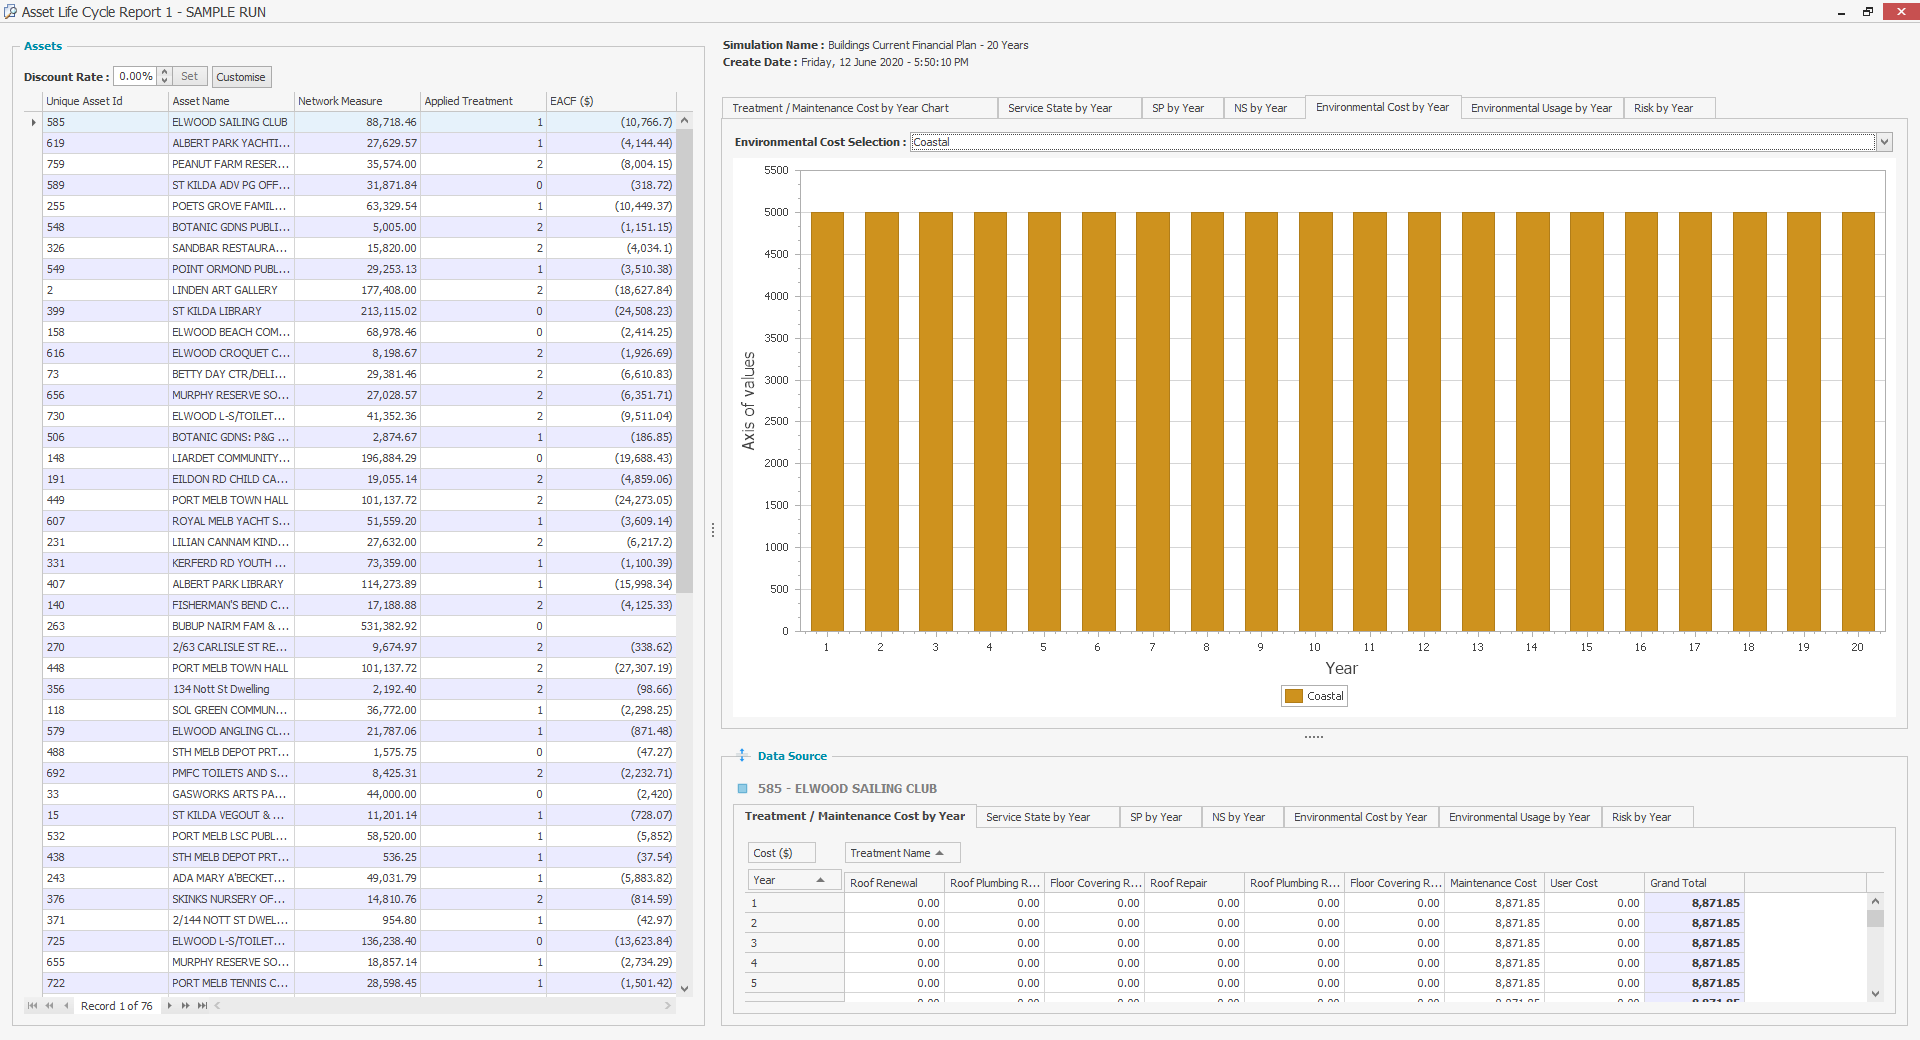
Environmental Cost by Year
Selecting the Environmental Cost by Year tab will show the total environmental cost per year for an asset if the Environment Parameters and Environmental Costs have been configured in your simulation, and Environmental Usage Mappings have been configured when importing asset data.The graph can be filtered by any configured Environment Parameters that have been added within the Template.
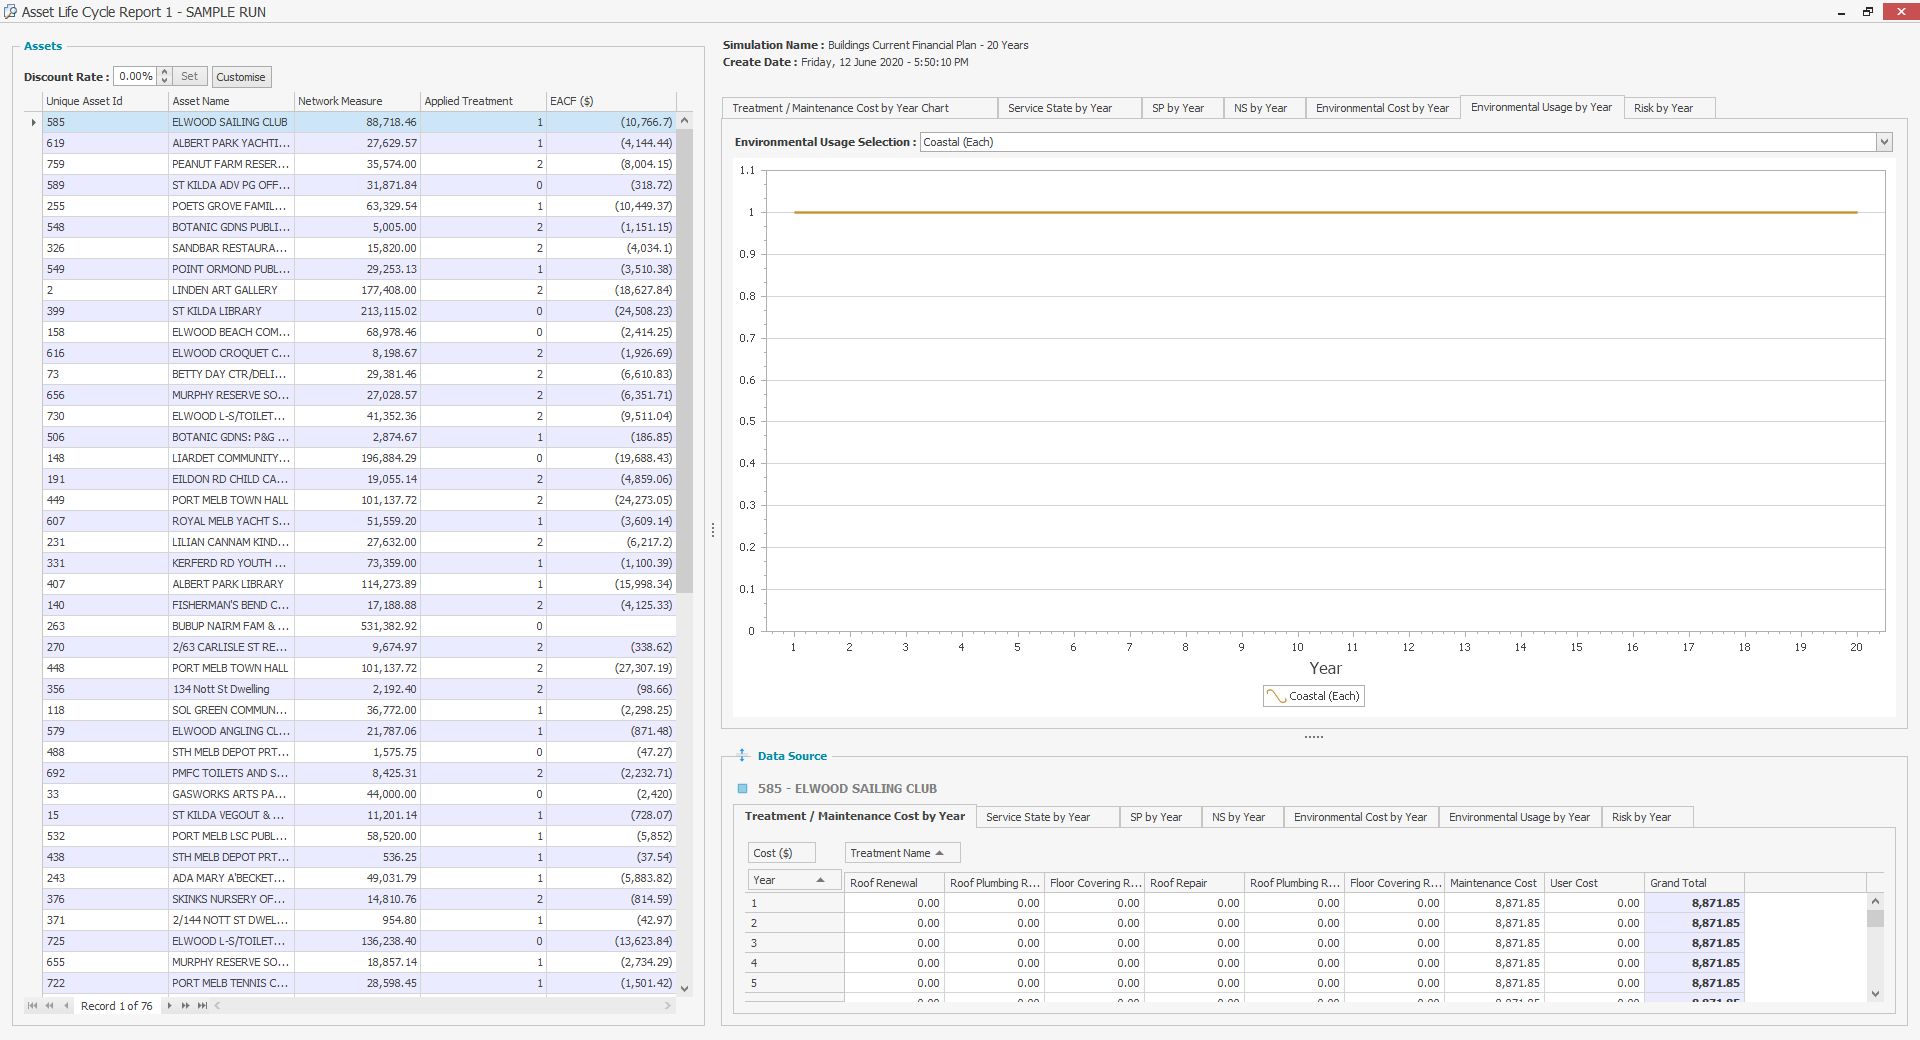
Environmental Usage by Year
Selecting the Environmental Usage by Year tab will show the total environmental usage per year for an asset if the Environment Parameters and Environmental Costs have been configured in your simulation, and Environmental Usage Mappings have been configured when importing asset data. The graph can be filtered by any configured Environment Parameters that have been added within the Template.
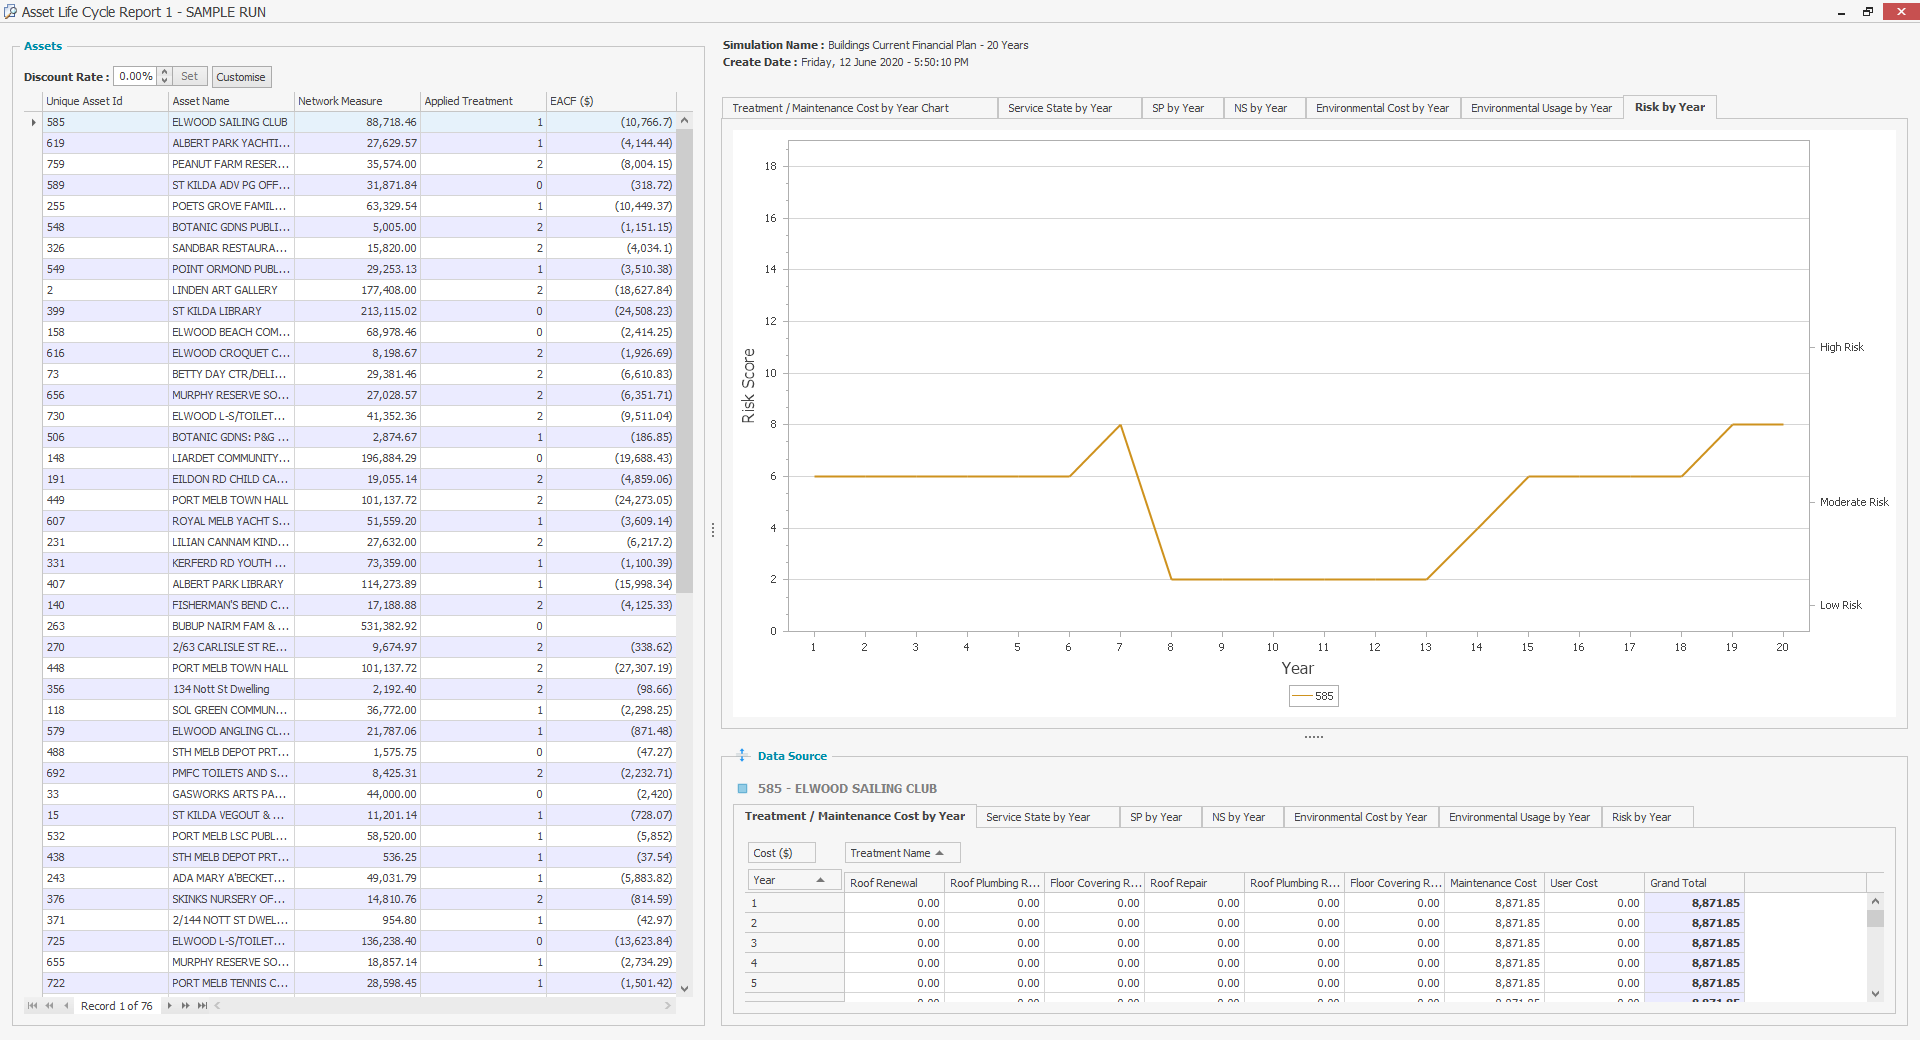
Risk by Year
Selecting the Risk by Year tab will show the risk value over time. This tab is only available when the Risk Configuration has been used and Consequence of Failure has been mapped in the 'Setup Mapping, Scaling and Import Source Data' wizard.
This sample run report allows users to identify and resolve any issues with their Model, before they publish full simulation results to the Web App, where the full version of the Asset Life Cycle report can be viewed.
