Risk Comparison Report
Objective: Gain an understanding of the Risk Comparison report
This report allows an organisation to compare the predicted risk behaviour of their asset portfolio as a result of their selected financial strategy.
Under ISO 31010:2009, Predictor utilises the consequence versus probability matrix to perform risk assessments and hence the following reports reflect this framework.
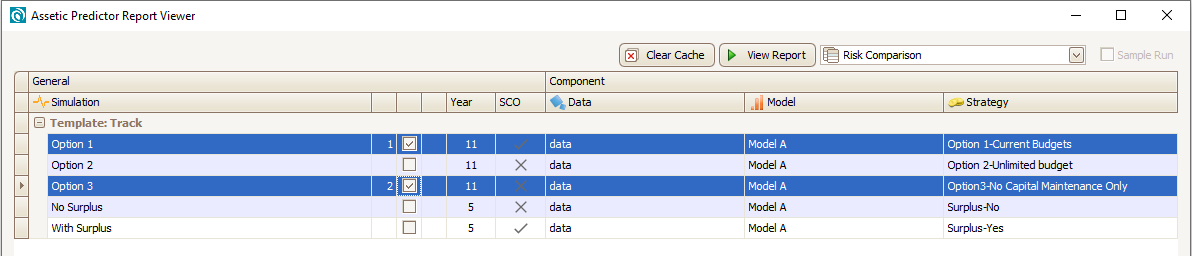
To load the report:
- Select Risk Comparison from the drop-down menu of the report viewer.
- Select the simulations to be compared.
- Click on View Report.
The Risk Comparison Report provides two reports named Risk Rating Distribution and Risk Score Aggregation. The Risk Rating Distribution report provides comparative information regarding an organisation's asset portfolio’s predicted risk behaviour as a result of the applied financial strategies in the Simulations. The Risk Analysis Report shows the asset quantity, asset value and asset network measure for each of the defined Risk Rating Labels, which are configured during the template set-up stage in the Advanced Configuration Module versus the allocated Financial Budget. The report by default will display the worst Risk Label, however, it can be filtered by the user to display only selected Risk Label types.
The Risk Comparison Report report is displayed, showing the Risk Rating Distribution:
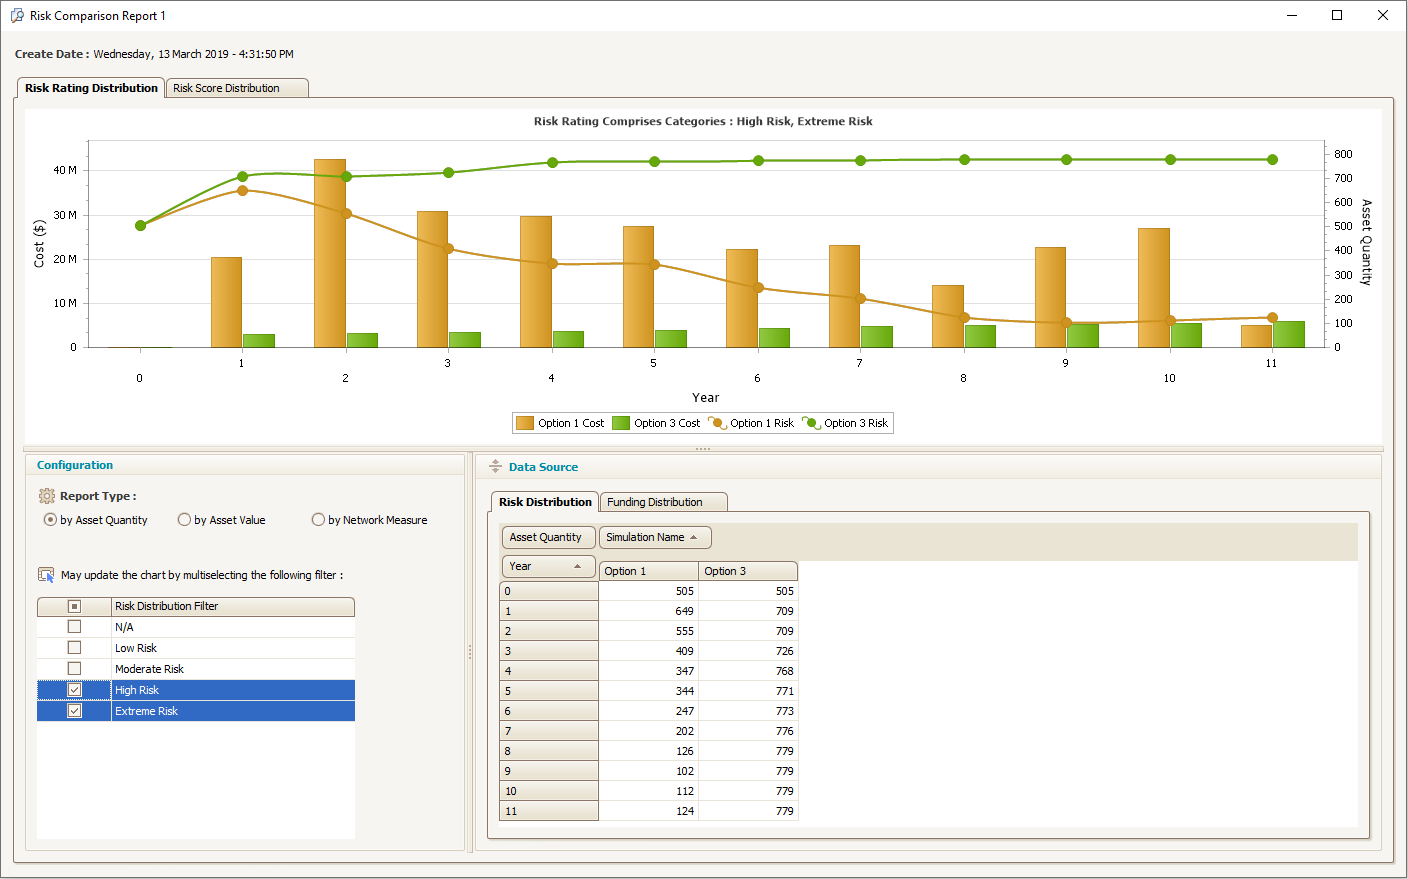
This example report illustrates that Simulation Option 1 model will result in a reduction from 505 assets in year 0 classified as high and extreme risk to 124 assets. However, funding constraints of Simulation Option 3 is predicted to result in an increase from 505 assets in year 0 classified as a high or extreme risk to 779 assets. We can also measure the replacement value of these assets by selecting the asset value radial button.
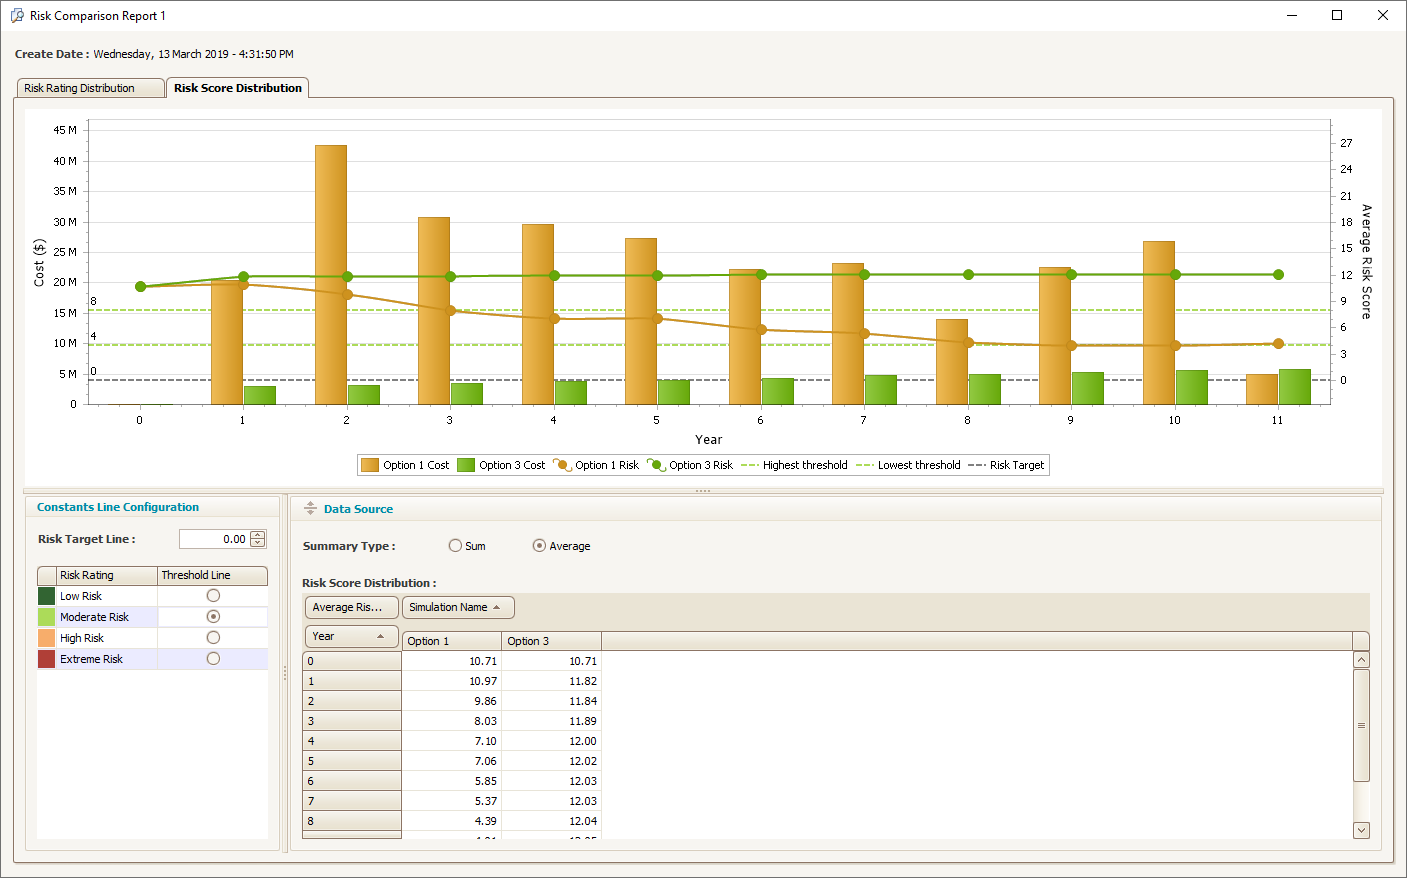
The Risk Score Distribution report provides comparative information regarding your asset portfolio's predicted total sum cumulative risk scores as a result of the applied financial strategies in your Simulations.
The Risk Score Aggregation report provides comparative information regarding an organisation's asset portfolio’s predicted total sum cumulative risk scores as a result of the applied financial strategies in the Simulations. The report will sum the calculated risk score of all assets for each year. Within the report, users may then select the Risk Rating threshold that their organisation finds acceptable in terms of the risk that it would like to work towards and the report will identify the lower and upper-risk score limits that selected Risk Label. Users can then compare the sum total risk for each year, against the selected bounds. Note that only one Risk Label can be selected as the threshold.
Selecting the Risk Score Distribution tab will display the following:

The report illustrates that both Simulation Options are predicted to return an on average risk score that is below the defined Extreme Risk Rating Label. However, if we now change the risk target to say Medium Risk, Simulation Option 1 is predicted to return an average network portfolio that is within these ranges. Whilst Simulation Option 3 is predicted to exceed this target as illustrated by the following report.