Asset Life Cycle Report
Objective: Gain an understanding of the Asset Life Cycle report
This report displays each asset in a list, together with its network measure. When selecting assets from this list, an overview of the capital and maintenance cost requirements for this asset will be displayed over the financial analysis period.
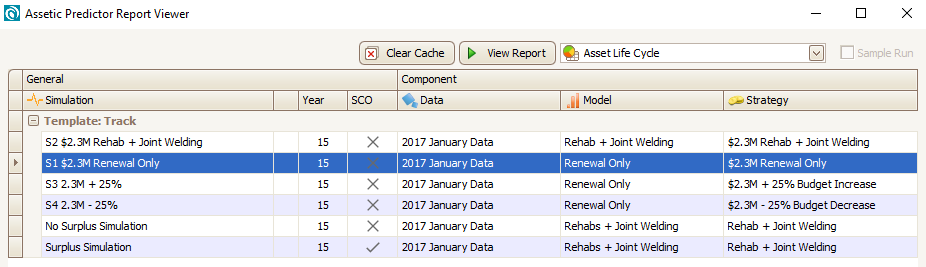
- Select Asset Life Cycle Report from the drop down menu of the report viewer.
- Select the simulation to be analyzed.
- Click on View Report.
The following screen will appear.
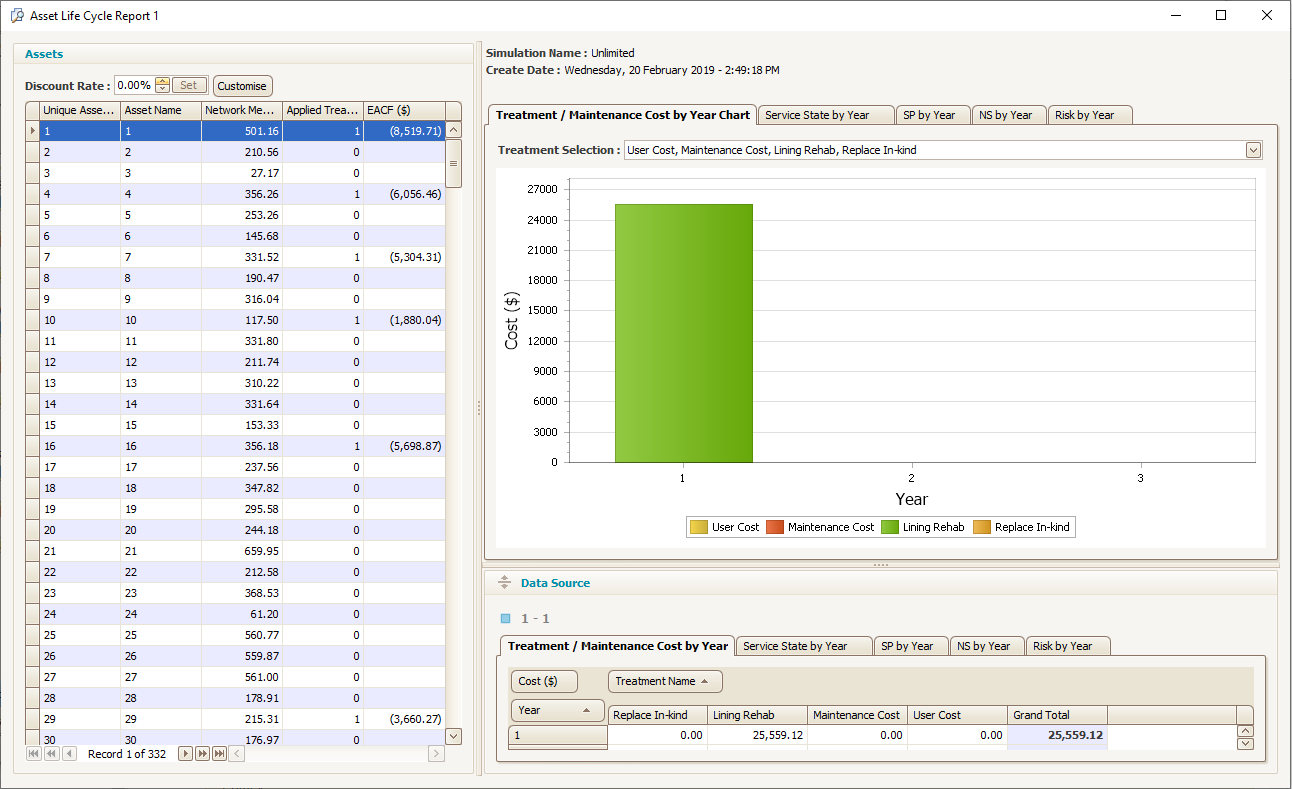
A discount rate can be set in the top left of this view.
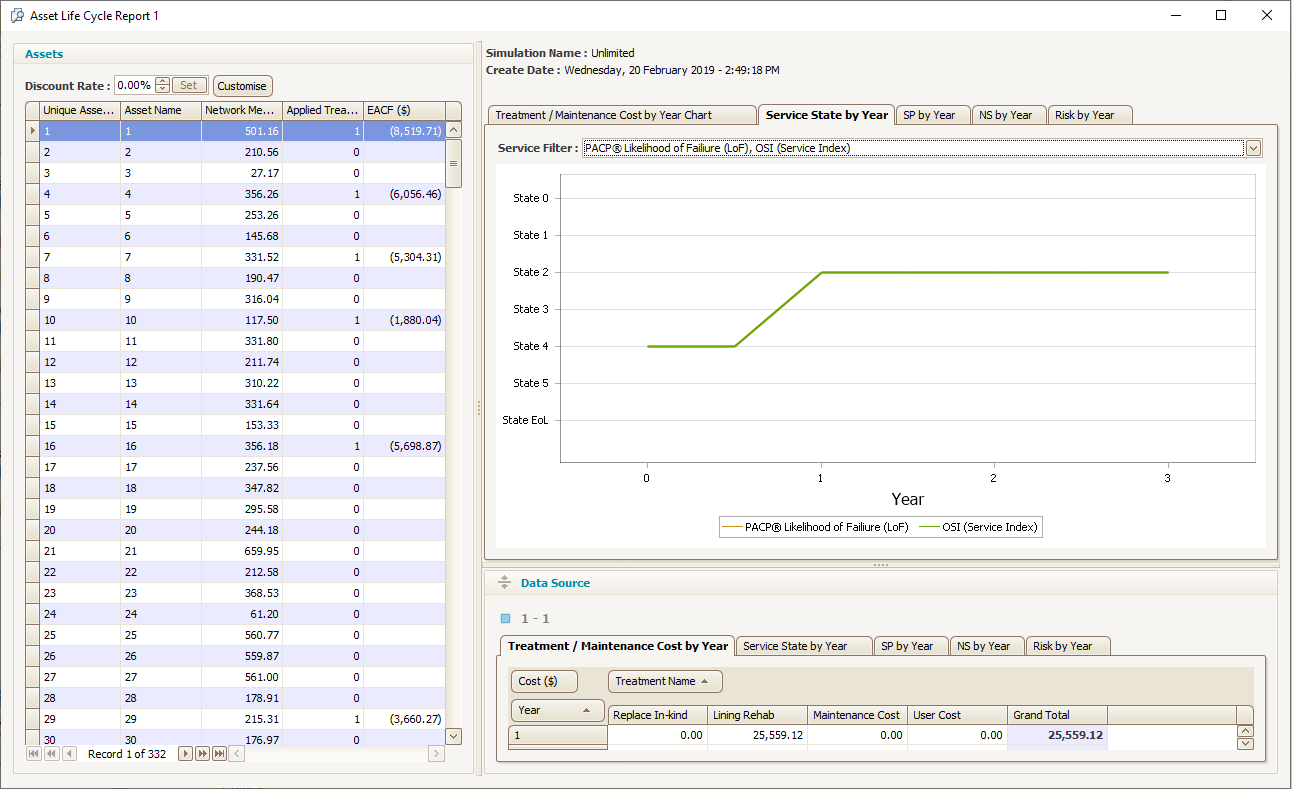
Selecting the Service State by Year tab above the graph shows how the service state degrades each year and how performing a treatment restores the service state to a higher level.
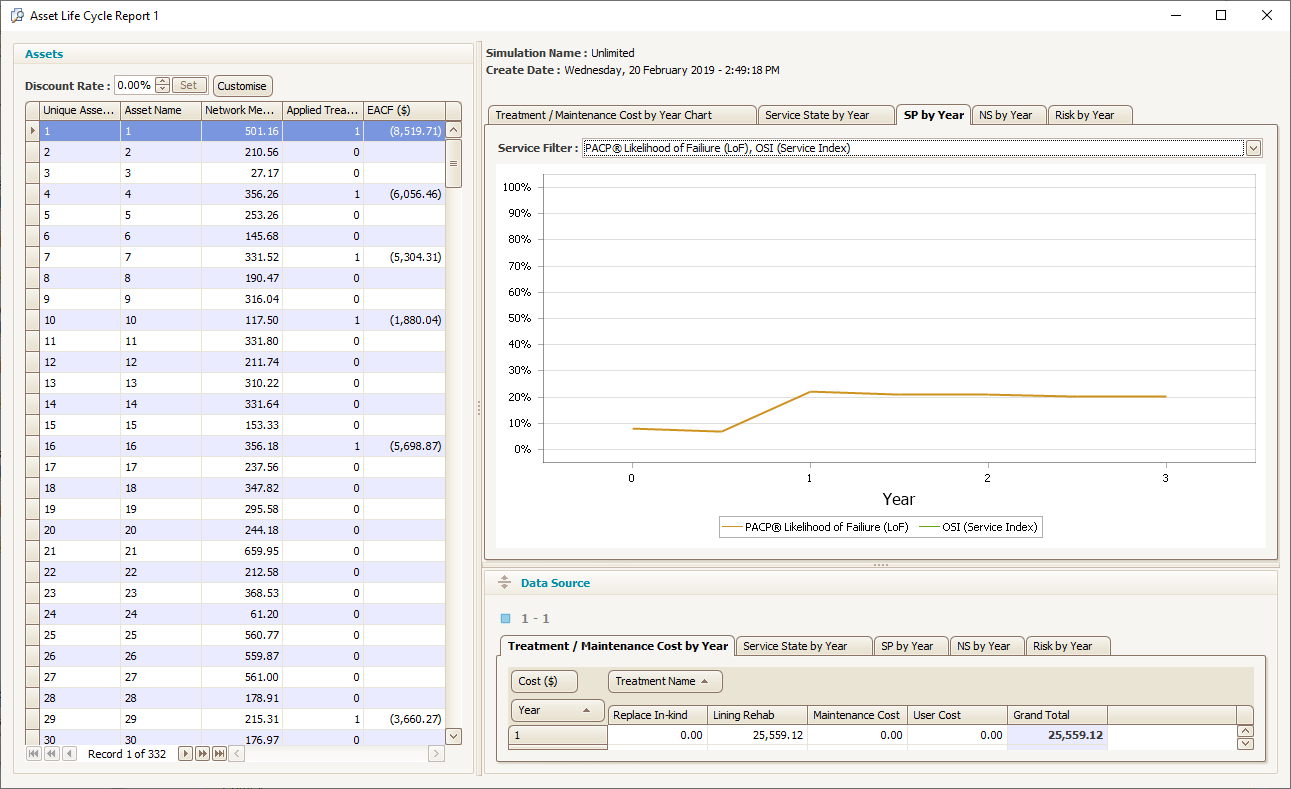
Selecting the Service Potential (SP) by Year tab will show how the service potential degrades each year and can be restored to a higher level by performing a treatment.
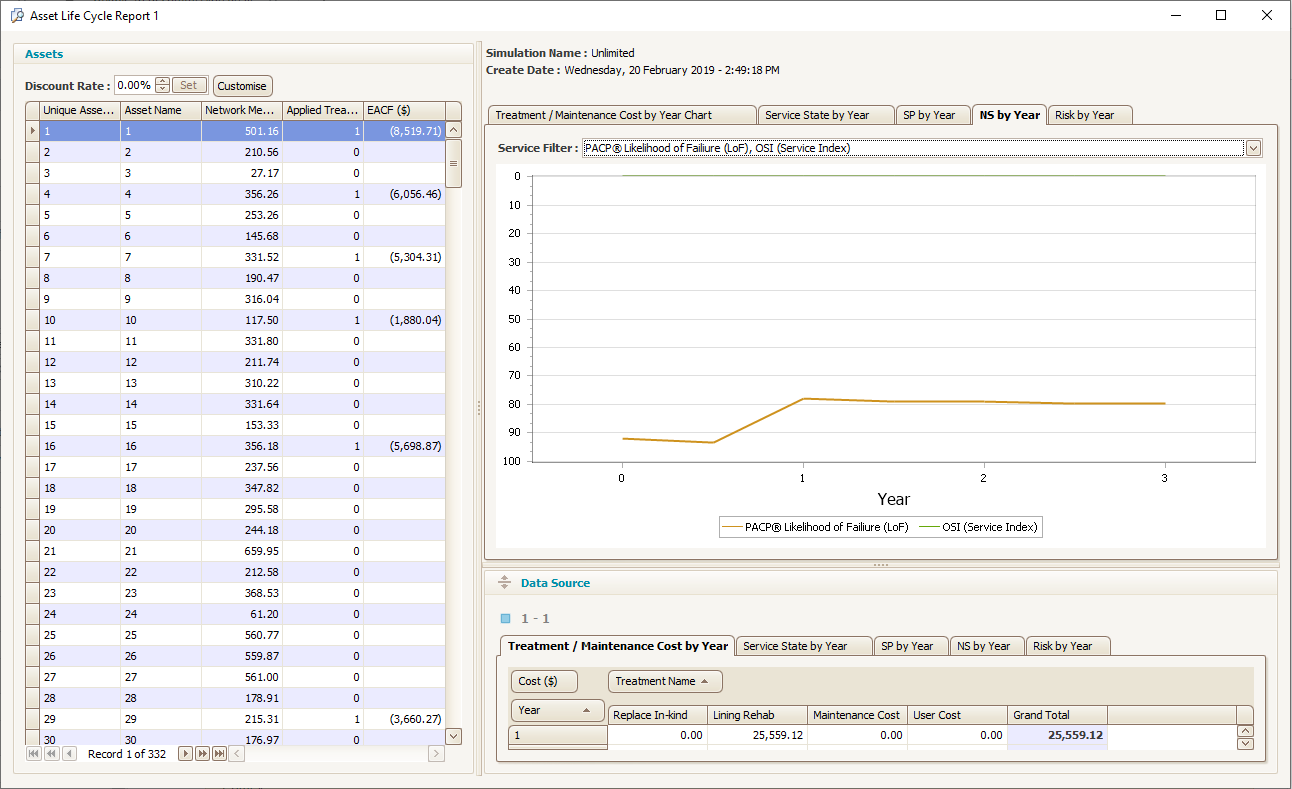
Selecting the Native Scale (NS) by Year tab will show how the service level degrades over time and can be restored to a higher level by performing a treatment.
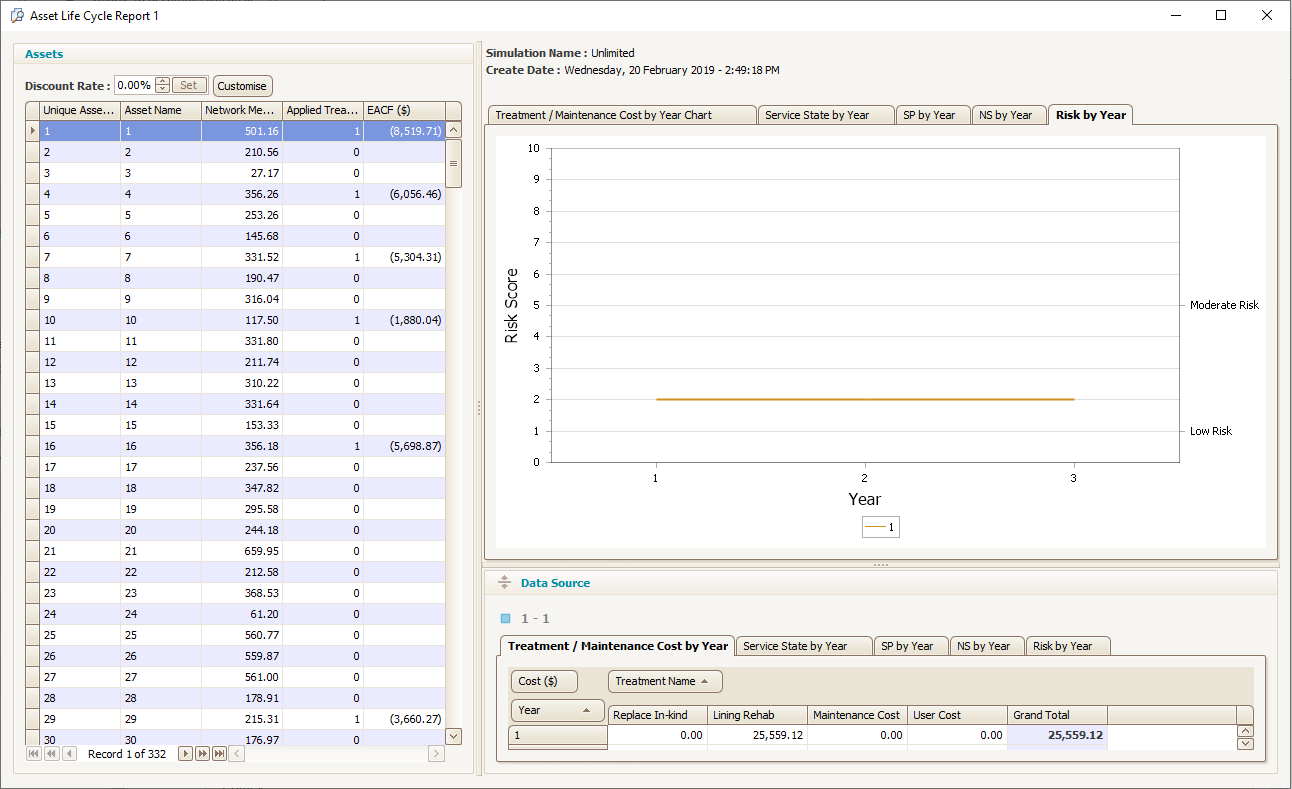
Selecting the Risk by Year tab will show the risk value over time. This tab is only available when the Risk Configuration has been used and Consequence of Failure has been mapped in the Setup Mapping, Scaling and Import Source Data wizard.