Net Present Comparison Report
Objective: Gain an understanding of the Net Present Comparison report
This report displays the life cycle costs associated for each Simulation in Net Present Value and Equivalent Annual Cash Flow terms.
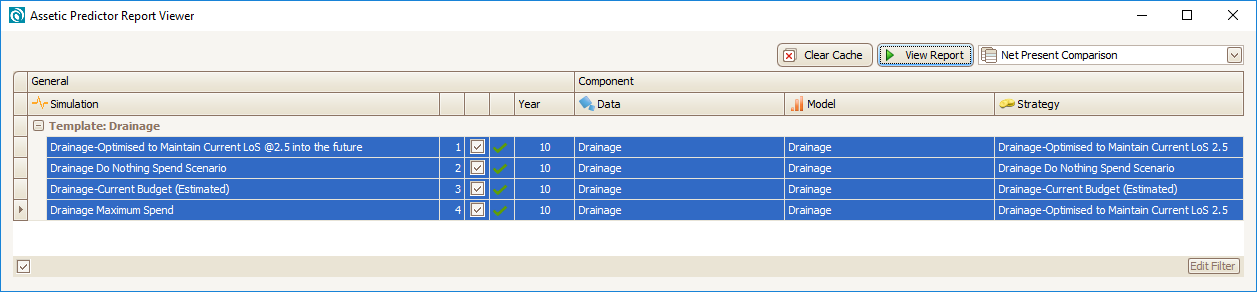
- Select Net Present Worth Comparison from the drop down menu of report viewer
- Select the simulation setups to be compared
- Click View Report
The NPW Comparison screen will appear:

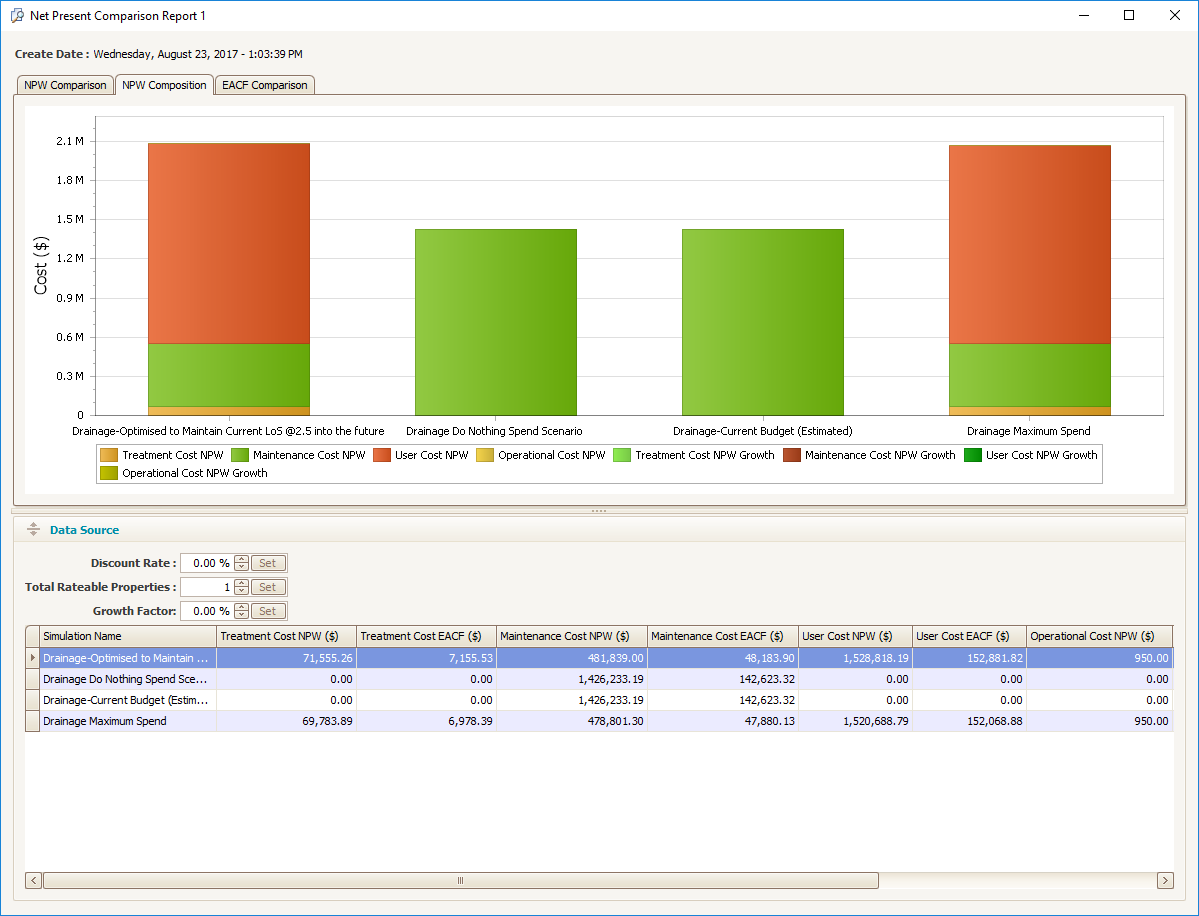
The Net Present Comparison report can also be viewed as a stack bar chart on the NPW composition tab:
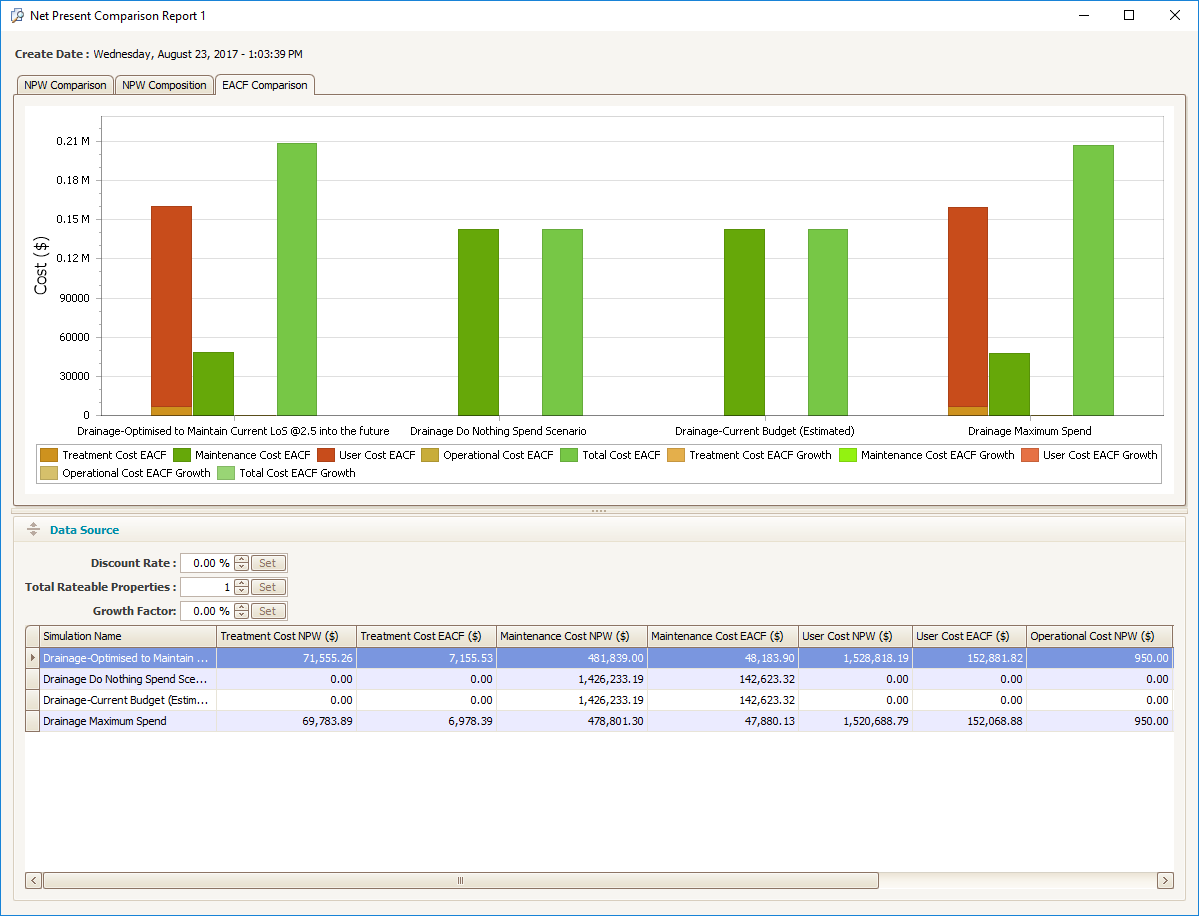
Equivalent Annualised Cash Flow (EACF) comparison tab will show the following view: