Custom Pivot Report
Objective: Gain an understanding of how to create a Custom Pivot report
A Custom Pivot report is a user built report that has been customized to utilize any desired information from their model, displayed as they like in a grid or chart form. A Custom Pivot report can be saved as a profile, meaning that it’s automatically up-to-date if the data in the underlying model changes.
Click View Report after selecting Annuity and Pricing from the drop-down menu. The following screen will appear:
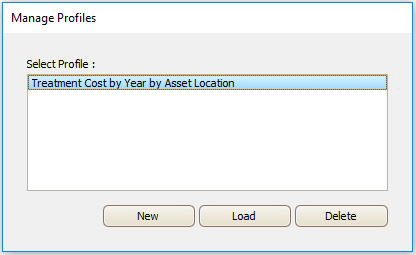
Saved Profiles can be loaded or deleted, or a new Profile created. Clicking New will open the Custom Pivot configuration window:
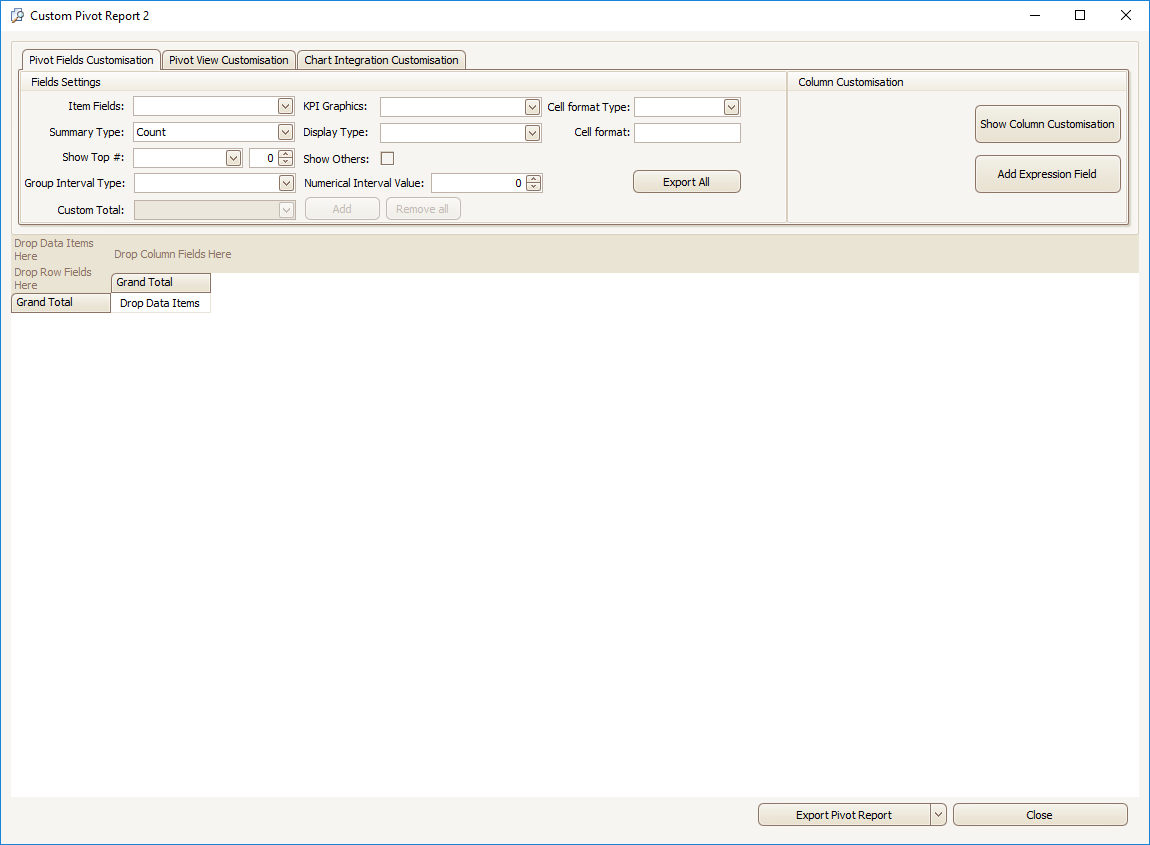
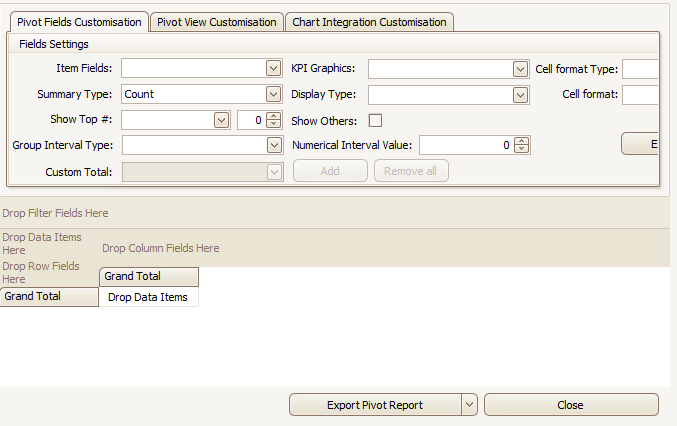
Pivot Fields Customization:
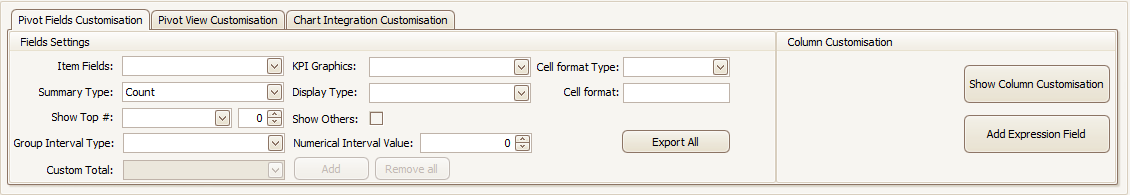
The Field Settings options allow a user to select any field in the report and configure how it is displayed. The ‘Show Column Customization’ and ‘Add Expression Field’ buttons allow a user to drag-and-drop new fields into the Pivot Grid. Clicking on ‘Show Column Customization’ will open a pop-up containing all available fields from the underlying model:
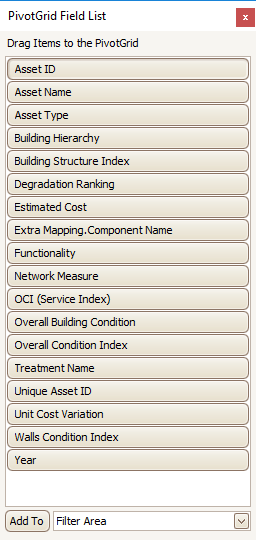
Fields can be added to the Pivot Grid either by dragging-and-dropping into the appropriate location, or selecting the field, and using the ‘Add To’ button to add it to the appropriate location. Once a field has been added, it can be moved further using the drag-and-drop feature, or removed from the PivotGrid by returning it to the PivotGrid Field List pop-up.
Clicking the ‘Add Expression Field’ button will open this window:
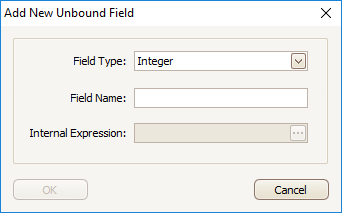
After giving the Expression Field a name, the Internal Expression can be configured by pressing the ‘…’ button:
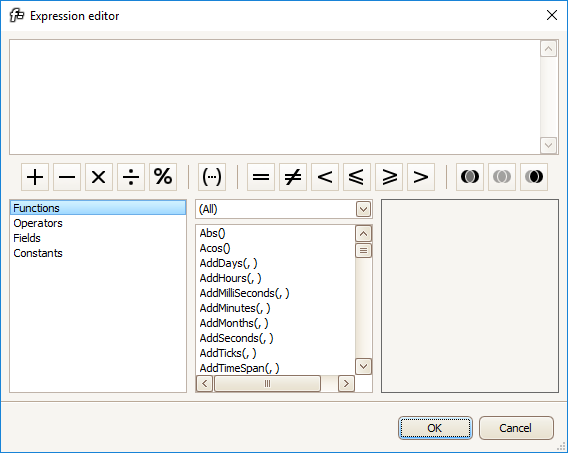
This is used to create custom fields which include complicated calculations. Once the formula is created, clicking ‘Okay’ will add it to the Pivot Grid.
Fields that have been added to the Pivot Grid can be further customized by using a filter. Mousing over a field will reveal the filter icon, and clicking on it will open the filter options:
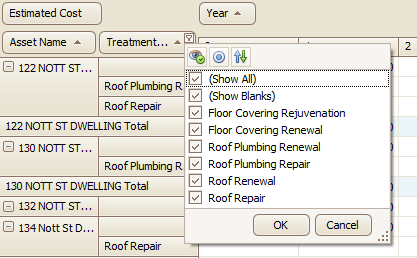
Note: Filters applied will persist even if a field is removed from the Pivot Grid. For example, if ‘Roof Renewals’ were unticked in the above screenshot, they would be absent from any results that are displayed in the grid even if the Treatment column were removed entirely. The filters must be reset to avoid this.
Pivot View Customisation
Clicking on the Pivot View Customisation tab will present a number of checkboxes which can be used to configure how the Pivot Grid is displayed:
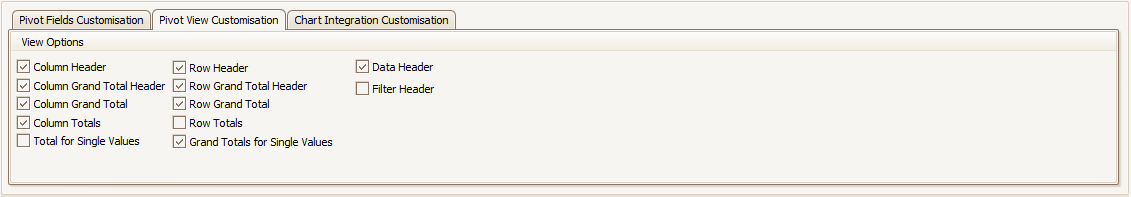
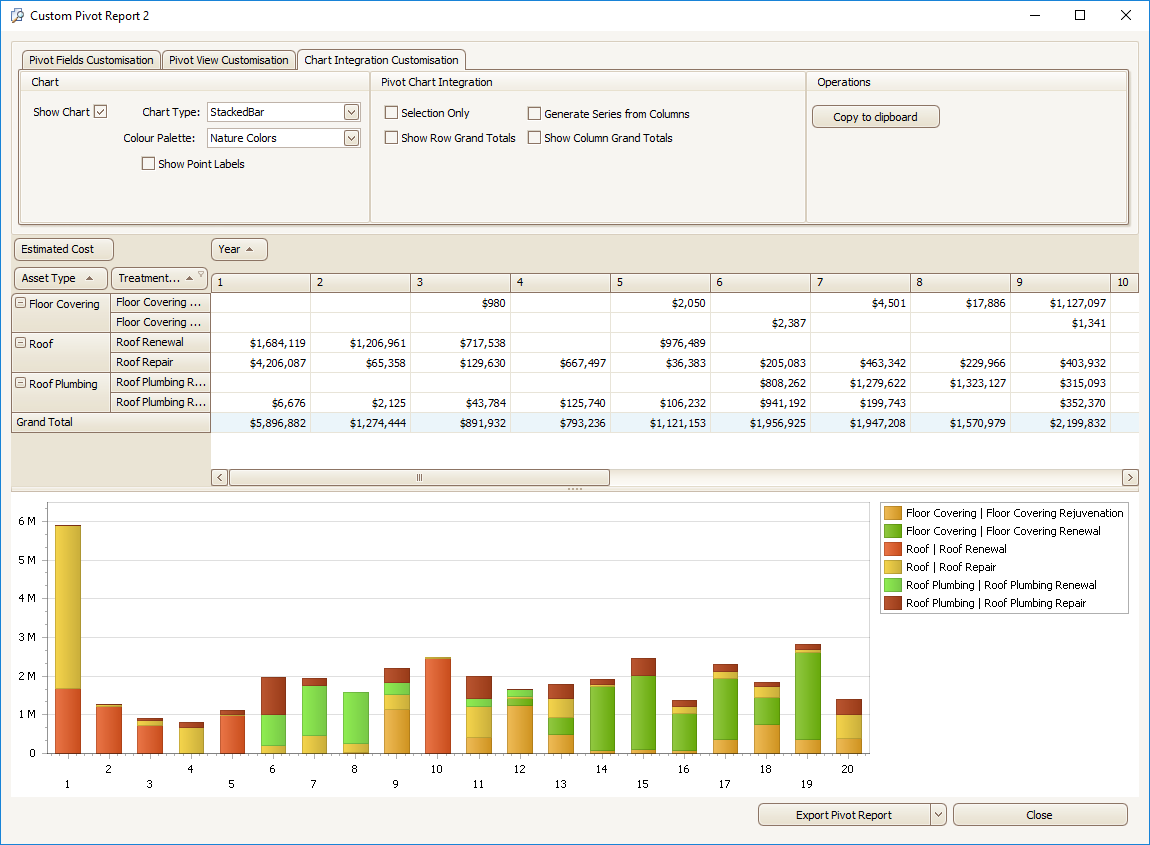
Chart Integration Customisation
Clicking on the Chart Integration Customisation tab will present the chart configuration options, including the ability to enable or disable chart visibility:
Saving a Custom Pivot Report Profile
To save a Custom Pivot Report, select the 'Close' button.
Important: When saving a 'Custom Pivot Report' profile, do not use slash symbols, either / or \ in the saved profile name, as this will generate an error in the system.
Choose 'Save New' and name the profile.
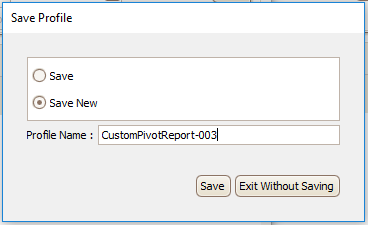
Select 'Save'.
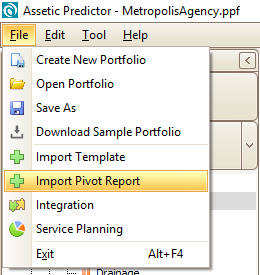
Importing Custom Pivot Reports