Capital Works Program Report
Objective: Gain an understanding of the Capital works Program report
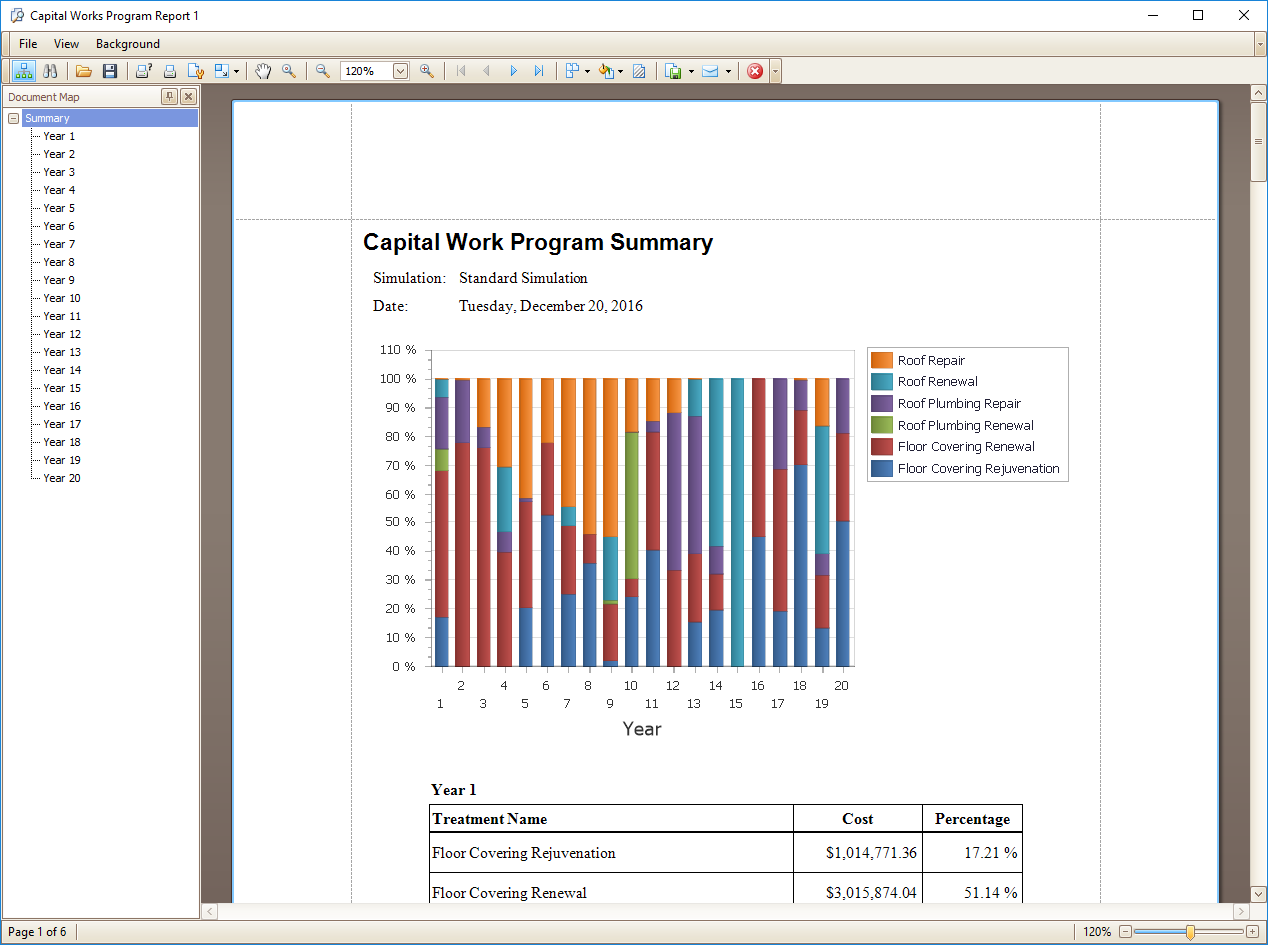
Generates a report with each year and treatment type, along with total sum treatment costs for each year of the financial analysis period. Clicking on one of the treatment types or the total budget for a year will open another report showing the detail of the treatment type in that year, along with the asset id and asset name. Also displays a stacked bar chart of the treatment distribution for each year of your financial analysis period. A typical Capital Works Program report looks like this:
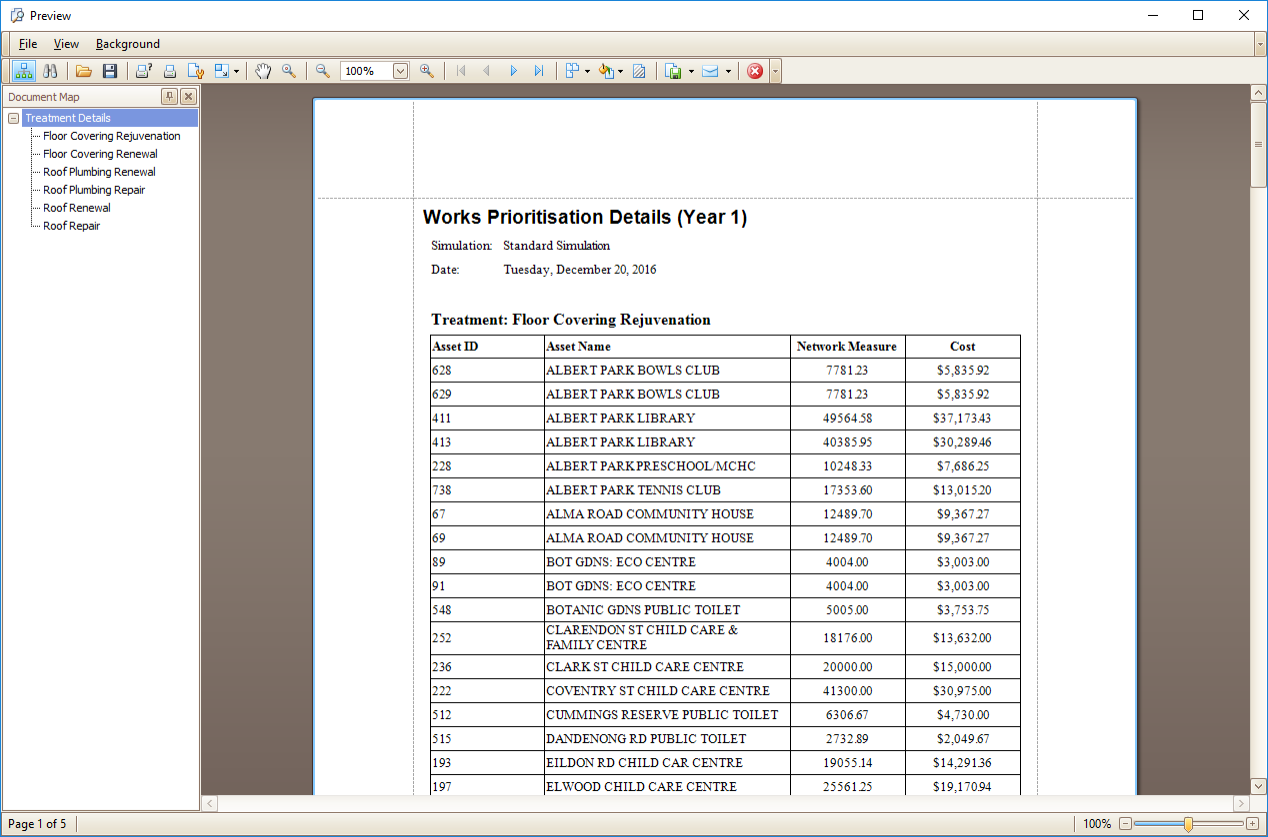
By clicking any treatment in a given year all assets that are due for that particular treatment in that year will appear in a separate screen. Similarly, by clicking on the year all assets that are due for treatment in that year will appear under the corresponding treatment as shown: