Import Data
Go to Data in your Template, which will contain the imported data once the process is complete.
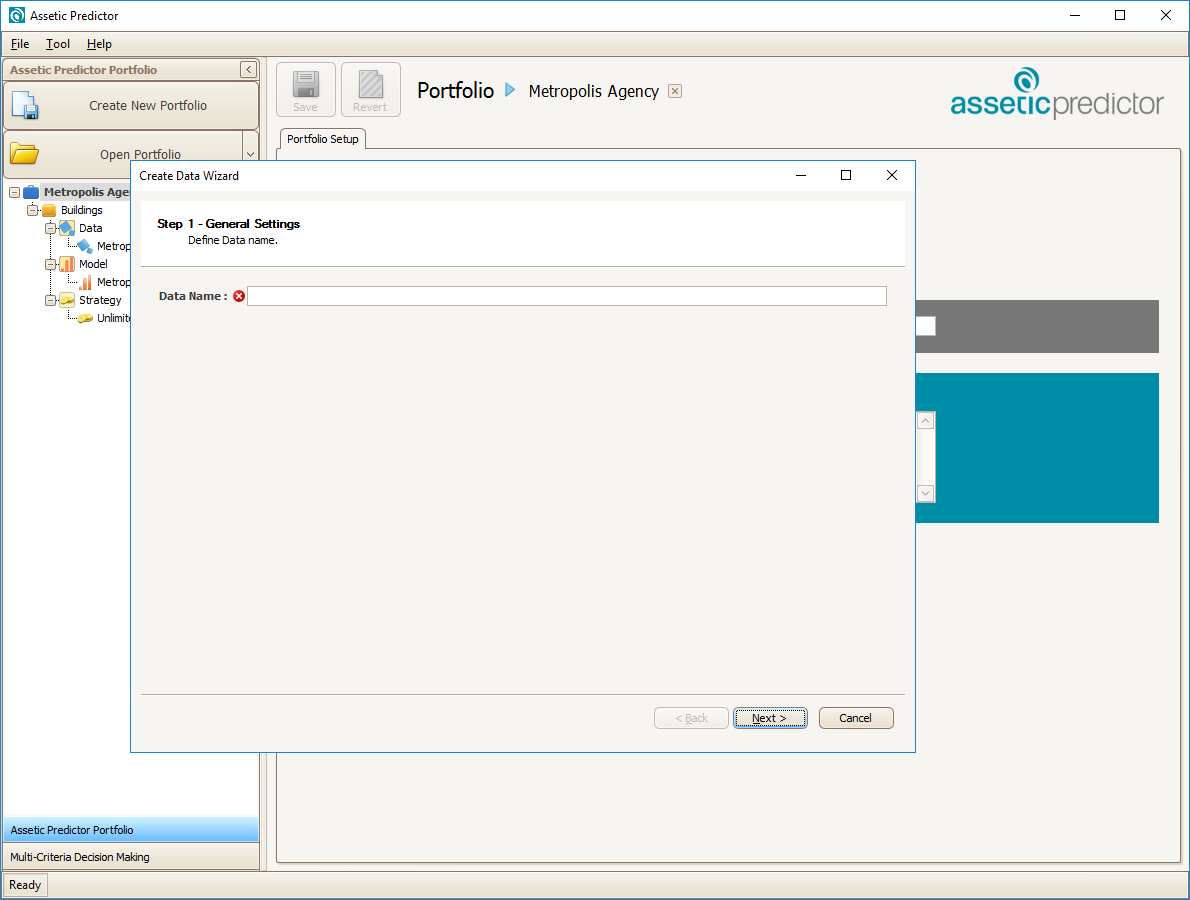
To begin, right-click Data and select Add. This will open the Create Data Wizard, at Step 1 – General Settings.
The following screen will appear:
Click Next, Step 2 - Choose Data Source of Create Data Wizard
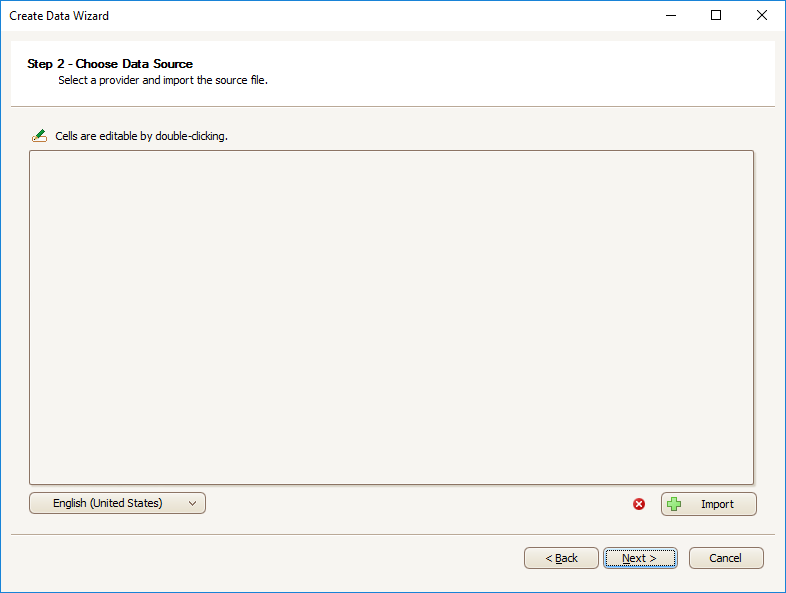
Note: The region setting will determine which date format and decimal point mark is used, and will default to the system settings.
- Click Import to select the data source
- The following screen will appear:
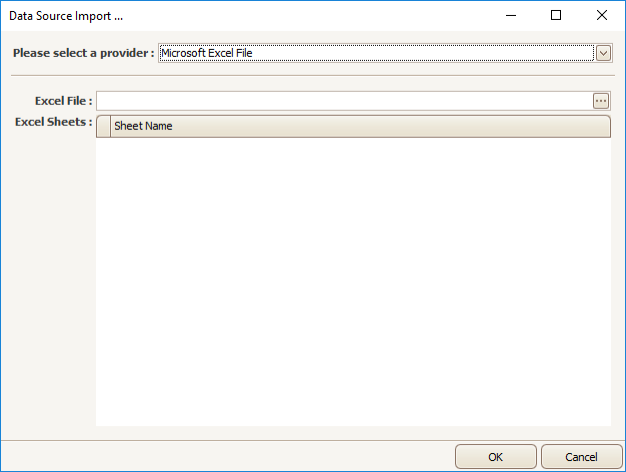
Note: the default file type is Excel.
Navigate to the source data file using the '...' button, and select your file. The selected data file will appear as below:
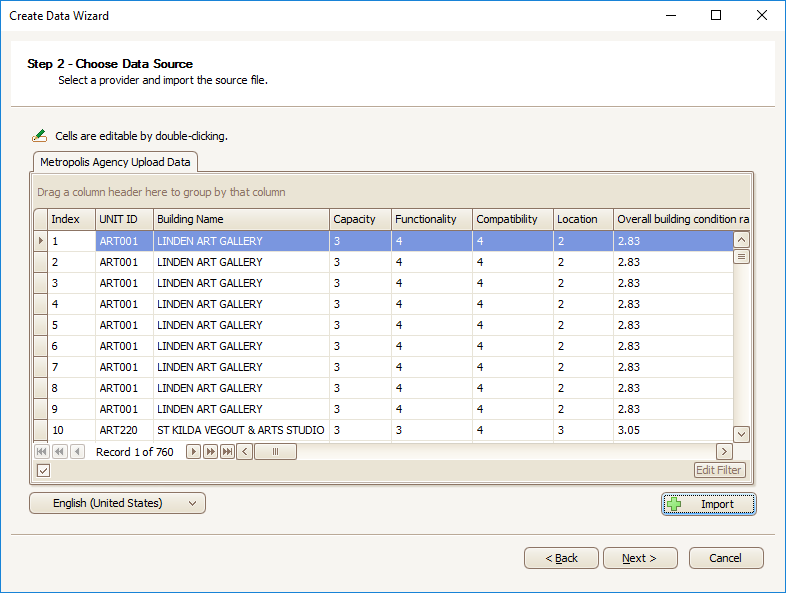
Check that the correct file is imported.
This step allows the User to confirm the validity of the file and the availability of all relevant data fields that may be required in modeling for the next steps.
- If OK, click Next
The following screen for Step 2 – Mapping, will appear:
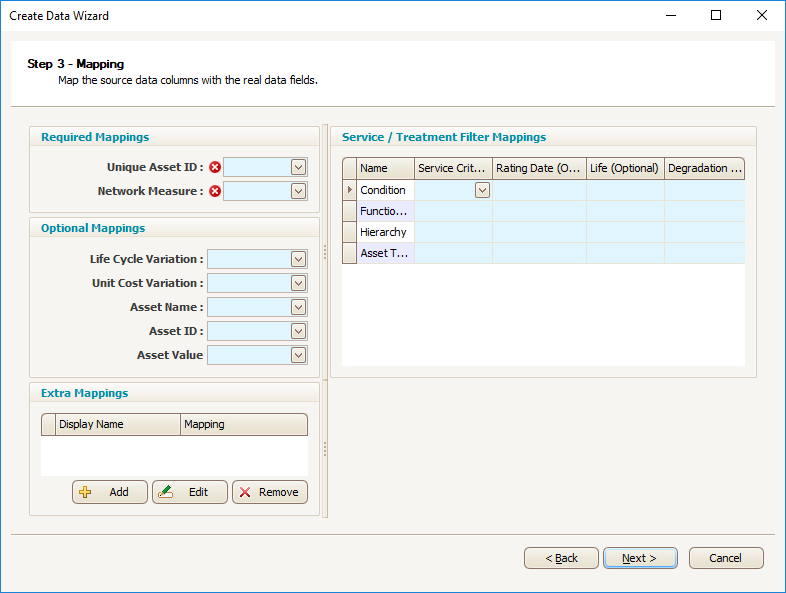
Here, map the Input Data Fields to relevant fields in Predictor, by clicking on the drop down menu of each field. All data column headers from the input file are visible, so select the relevant data column for each field
Required Mappings:
- Unique Asset ID: Each asset in the input data sheet must have a unique identifier.
- Network Measure: Network measure is used to indicate the absolute or relative size of the assets in a template. This can correspond to the physical size of the assets, such as the trafficable area for roads, length for pipes and floor area for buildings, or renewal cost, such as for buildings.
Optional Mappings:
- Life Cycle Variation: If assets in imported data have different useful lives, Life Cycle Variation can be used to distinguish assets from predominant useful life.
- Unit Cost Variation: The same treatment on different assets may incur different treatment costs. This can be due to location, criticality, or any specific nature of assets.
- Asset Name: It is recommended that Users provide an asset name for each of the assets, as this is helpful in identifying assets.
- Asset ID: If there is an asset ID, (eg. a third party system ID), that is different to the unique asset ID, Users can map them to Asset ID.
- Asset Value: This is typically the unit replacement rate for the asset.
Extra Mappings:
- Users can add any number of extra mappings, as required, using the 'add' button in the Extra Mappings box. Extra mappings can be used in some reports.
Service / Treatment Filter Mappings:
- Service Criteria: Map the Service Criteria/Treatment Filters to the relevant column in the import data.
- Rating Date (Optional): Map the Rating Date for a Service Criteria to column in the import data. If the field is left unmapped, or the imported cell for a specific asset is blank, then the Rating Date will default to the current date. Treatment Filters do not have a Rating Date and so this mapping is not used.
- Life (Optional): Map the Life for a Service Criteria to column in the import data. If the field is left unmapped, or the imported cell for a specific asset is blank, then the value default to the default life configured in the Life Cycle tab of the Model. Treatment Filters do not have a Life and so this mapping is not used.
- Degradation Profile (Optional): Map the Degradation Profile for a Service Criteria to column in the import data. If the field is left unmapped, or the imported cell for a specific asset is blank, then the Degradation Profile used will default to the value configured in the Life Cycle tab of the Model. Treatment Filters do not have a Degradation Profile and so this mapping is not used.
After all the mappings are completed, click Next to go to Step 3 - Scaling
The Scaling step is where raw asset data is converted into service criteria. Data needs to be scaled into numeric values for modeling purposes. The numerical scale in Predictor allows data to be scaled in a score from 1 to 5 (based on IIMM and NAMS guidelines). Generally a score of 1 represents new condition and 5 represents very poor condition. Predictor assists with setting scales by displaying the raw data values that it has detected in the asset data file.
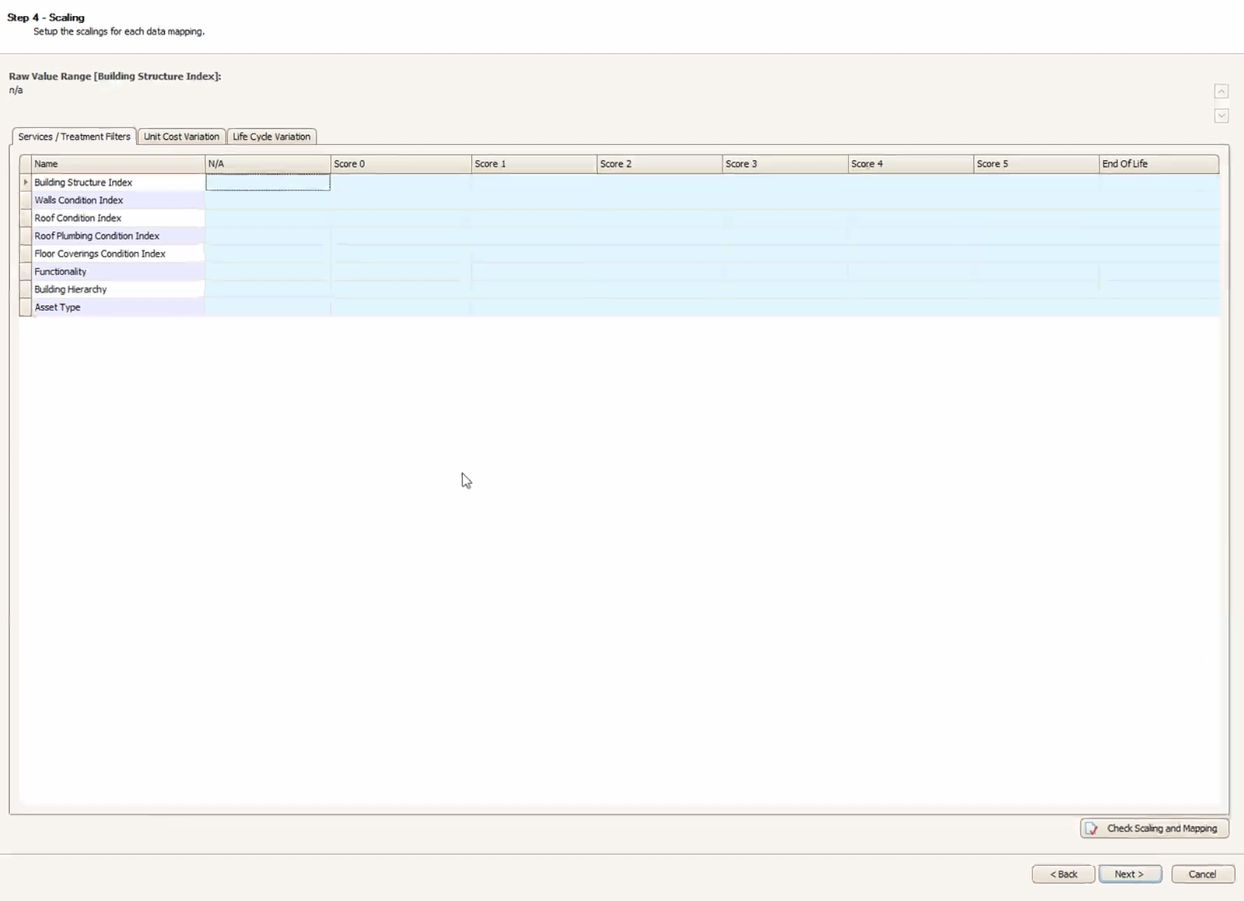
Note: N/A (Not Applicable) can be used where specified criterion is irrelevant for a particular asset. For example, if a user is modeling sealed and unsealed roads together, for unsealed roads the surface condition is irrelevant. In this case for unsealed roads surface condition, users can put N/A.
Numeric ranges can be mapped to a score using a dash (e.g. 1-3), one or more Alphanumeric values can be mapped using a colon (e.g. Corrugate Iron; Roof Tiles), and blank cells in the import data for Service Criteria or Treatment Filter Scaling can be mapped using 'ISBLANK':

Note: When there are overlapping scaling ranges, Predictor will use the higher condition score as the result of the scaling. For example, if a user is scaling 0-2 to be Score 1, and 2-4 to be Score 2, then an import of exactly 2 would result in Score 2.
The Scaling can be checked at any time by using the Check Scaling and Mapping button.
Unit Cost Variations and Life Cycle variations can be configured on the appropriate tab:
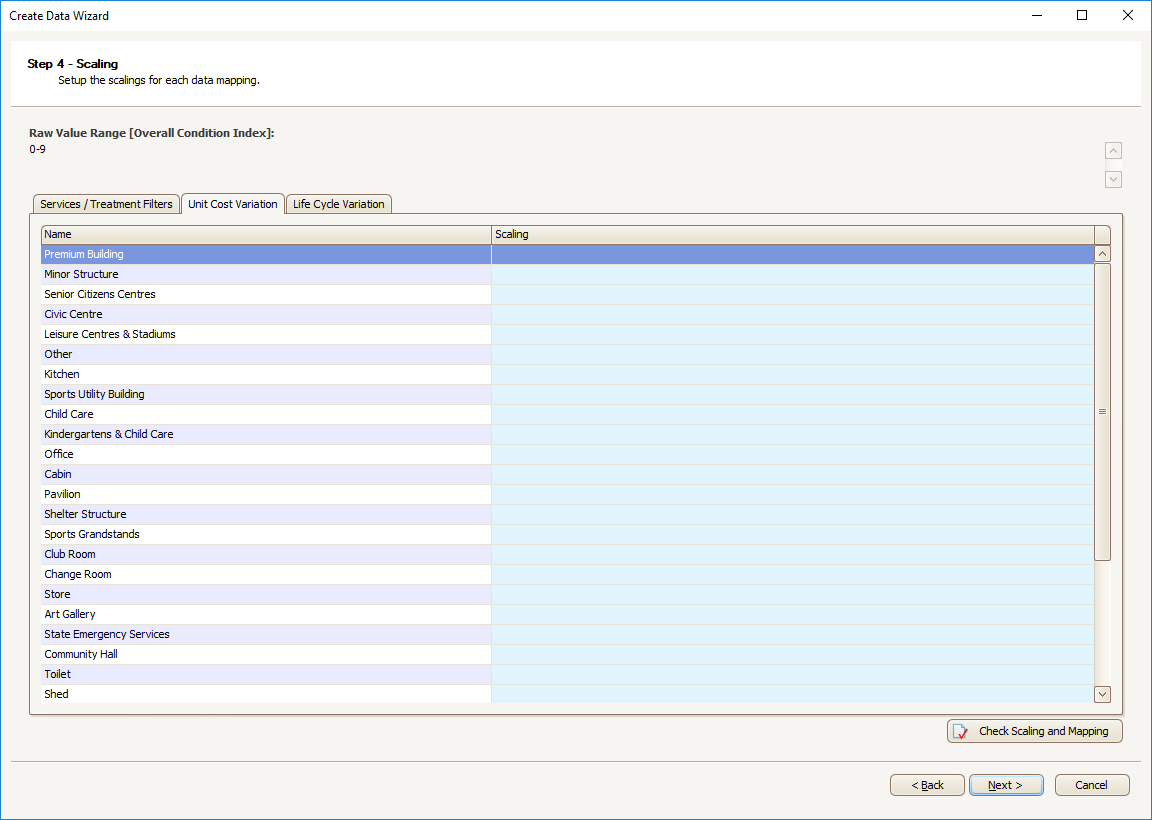
Multiple Scalings can be configured in bulk by right-clicking and pasting.
- Click Next after Scaling Check is completed. The screen showing that the User has completed data importing will appear.
- Click Finish to exit the Data Import Wizard, or to go back and change any data mapping click Back.
