Back to Asset Essentials Main Menu
Utilization dashboard
The Utilization Dashboard allows you to see your organization's utilization as whole as well as a utilization rate for each of your users or employees. You can see an aggregate view of an employee’s planned utilization compared to their actual utilization. The utilization rate for each date that work was assigned to your employee will also be displayed. *Note: Not all clients are eligible for Analytics. To learn if you are eligible, contact Client Services.
Your dashboard updates every morning with the current year's data through the end of the previous day as well the previous calendar year of data.
Utilization Dashboard
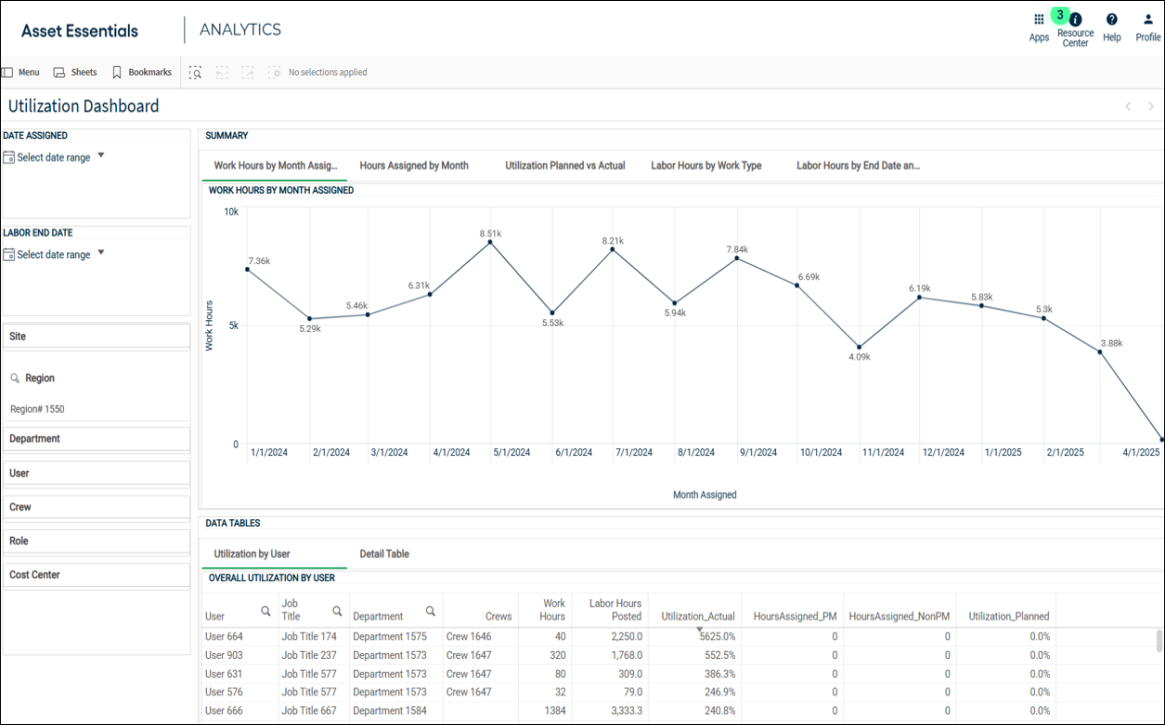
To access the Utilization Dashboard, click the Analytics menu icon, then select Utilization Dashboard.
-
An employee's planned utilization is a calculation of their estimated labor hours divided by the number of hours an user is supposed to work each day, based on their work shift in Asset Essentials.
-
The estimated labor hours are generated from the estimated hours field for an employee's assigned work orders.
-
An employee's actual utilization is defined by a calculation of labor hours logged divided by the number of hours an user is supposed to work each day based on their assigned work shift in Asset Essentials.
Summary
Click the tabs at the top of this section to view the available charts:
-
Work Hours by Labor End Month: Total work hours available by month.
-
Hours Assigned by Month: PM and Non-PM assigned work hours by month.
-
Utilization Planned vs Actual: Visualization of planned utilization vs. actual utilization by month.
-
Labor Hours by Work Type: Pie chart that displays the percentage of labor hours logged by work type.
-
Labor Hours by End Date and User: Line graph that displays labor hours logged by End Date and User.

Data Tables
Click the tabs at the top of this section to view the available tables:
-
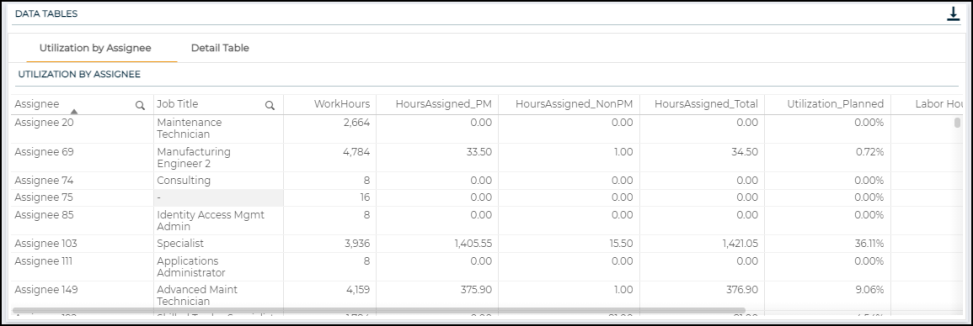
Utilization by User: Displays a summary by user of their total hours and overall utilization. The user’s utilization percentage (Utilization_Actual) is calculated by dividing ‘Labor Hours Posted (Excludes Overtime)’ by ‘Work Hours’, and it excludes overtime hours logged by the user. If a user has Work Hours equal to 0, please update their Work Shift on their User profile in Asset Essentials.
-
Detail Table: Displays a more granular view of each user’s hours worked, broken out by each individual labor end date that labor hours were logged.