Back to Asset Essentials Main Menu
Maintenance Forecast
Maintenance Forecast is a set of dashboards that provide insights into past and upcoming work, helping ensure your organization has the right staff and resources to efficiently complete future tasks and manage your assets. It displays the expected work orders, along with their historical and projected hours and costs, enabling you to plan and budget more effectively by leveraging past data to inform funding decisions. *Note: Not all clients are eligible for Analytics. To learn if you are eligible, please contact Client Services Team .
-
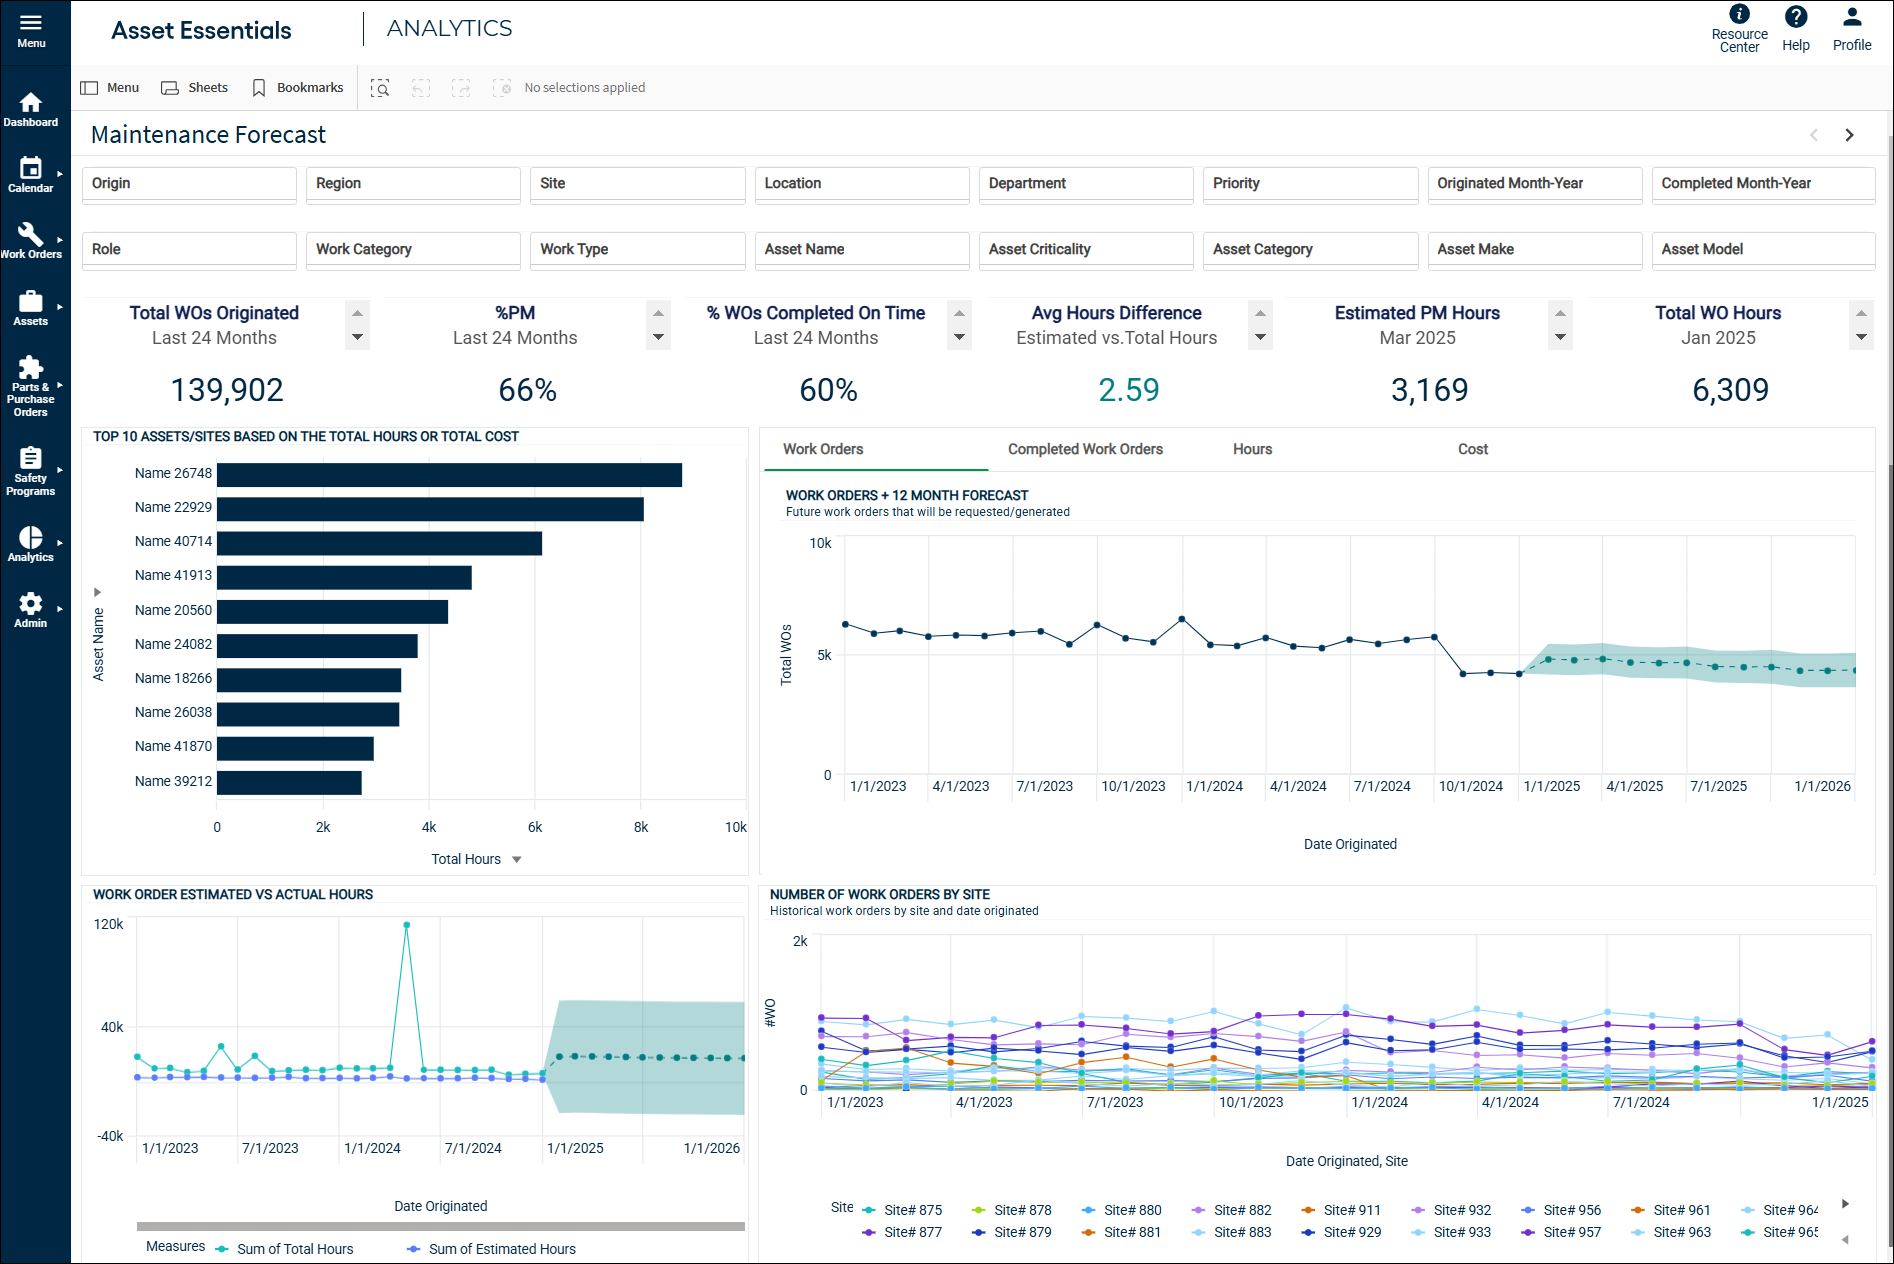
There are various filters at the top of this dashboard that allow you to slice the data by various dimensions and dive deep into work and asset data. By default, this dashboard includes data from the previous 2 years (24 months), excluding the current month.
Maintenance Forecast
Accessing Maintenance Forecast Dashboard
-
Login to Asset Essentials.
-
Click Analytics, select Maintenance Forecast.
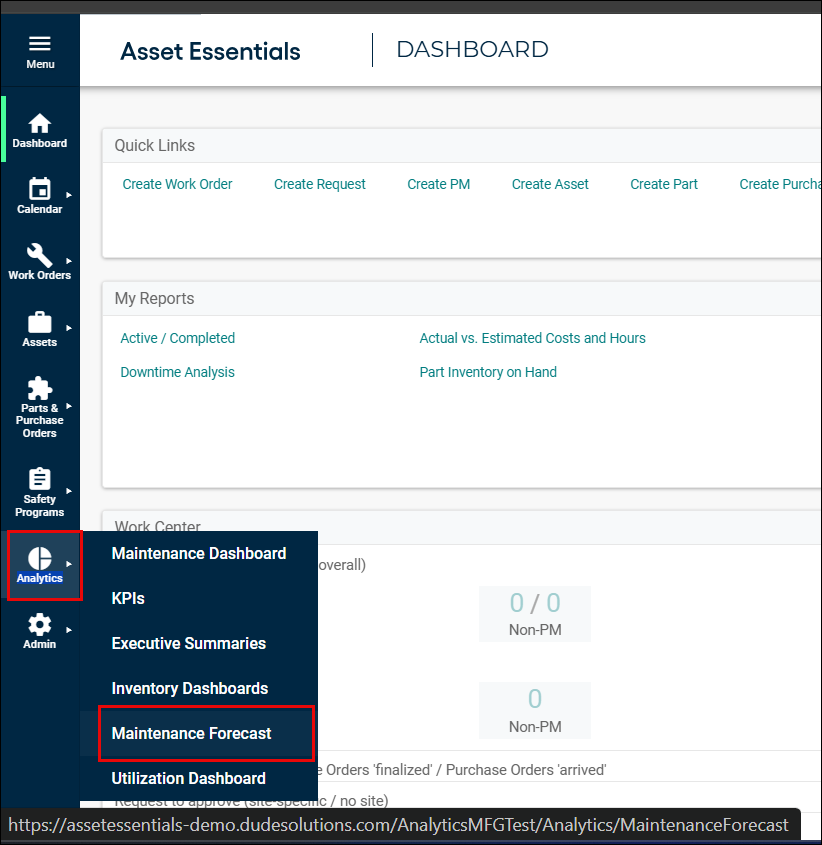
-
The Maintenance Forecast dashboard appears, proceed to next section.
Maintenance Forecast Insight
KPIs
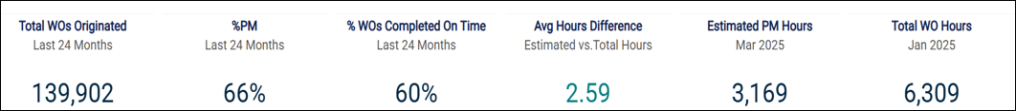
These key performance indicators provide a snapshot of the current trends associated with your organization’s maintenance.
-
Total WOs Originated: Shows the total number of Work Orders within a specific timeframe. It helps to filter and analyze specific data subsets. Forecasts are heavily impacted by the quantity and quality of data informing them, so it is useful to consider the count of work orders alongside any forecasted values.
-
% PM: Shows the percentage of the total work orders originated in the time frame that are Preventive Maintenance (PM) work orders.
-
% WOs Completed On Time: Shows the percentage of Work Orders that were completed on time. This can serve as a benchmark as you are evaluating the amount of work upcoming and inform how to best plan for upcoming work. This KPI is also useful to note as you are filtering because it may identify certain subsets of work that generally take longer to complete than others.
-
Avg Hours Difference: Shows the absolute value of the average difference in hours between the Estimated Work Order Hours and Total Work Order Hours. This KPI can inform whether work orders are generally taking the amount of time that they were estimated to take. Values have been color coded to give a quick understanding of how close the two values are. Values less than 4 hours are teal; values between 4 and 8 hours are orange; values above 8 hours are red.
-
Estimated PM Hours: Shows the upcoming PM hours that are scheduled for the next calendar month . This allows you to ensure that there are enough staff to cover the estimated hours.
-
Total WO Hours: Shows the work order hours from the previous month. This is a valuable KPI to evaluate alongside the previous KPI, as this KPI includes both PM and Non-PM.
Visualizations
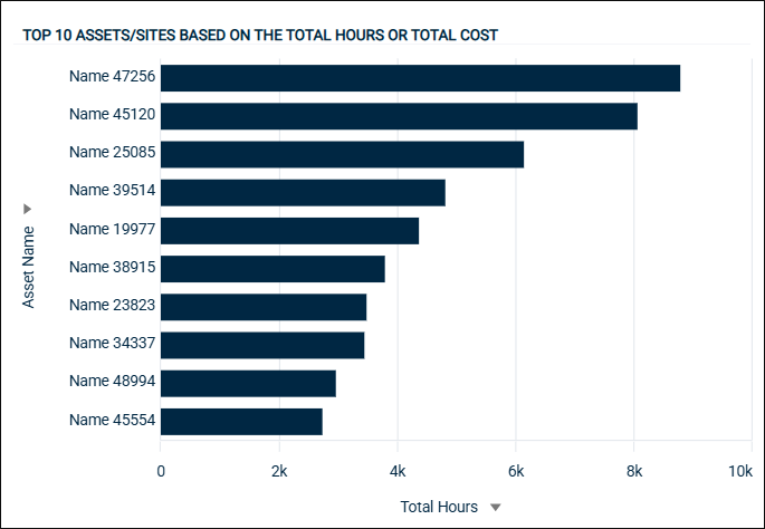
Top 10 Assets/Sites/Locations by Total Hours, Total Cost, or Total Number of Work Orders
By default, this chart displays the top 10 assets that have had the largest number of work order hours tied to them. There is the ability to toggle to Sites or Locations using the dropdown on the left side of the chart and/or toggle to total cost or total number of work orders by using the dropdown on the bottom of the chart. This gives a high-level view of which assets and sites require the most resources and will update with filter selections.
Forecast
Methodology
This container object displays twelve-month forecasts that are derived by analyzing 24 months of historical data. Generally, these forecasts are produced by extending trend lines from your historical data. They display predicted values which are generated and presented on the line chart. Additionally, there is a shaded area representing the confidence interval, which displays possible values with a configurable level of confidence. The shaded region indicates that future values are expected to lie within the shaded area with a probability of 90%. Time series forecasts are produced using a trusted, predictive function called Singular Spectrum Analysis (SSA). The SSA is an algorithm which identifies noise and seasonality as well as trends. The forecasts are generally driven by patterns found in your work order data over the previous 24 months, including:
-
Evidence of an upward or downward trend over time
-
Seasonal influence (E.g., high volumes in August)
-
Historical volatility
Eligibility, Errors, and Forecast Limitations
The goal of the forecast is to generate predictions for the next twelve months that align with the historical patterns seen in the data. It is meant to highlight statistically significant patterns and push them into the future.
-
The forecast does not specifically consider external factors, like business strategy changes, unexpected emergencies, or system updates, though the effect that these have on the historical data can influence the forecasts.
-
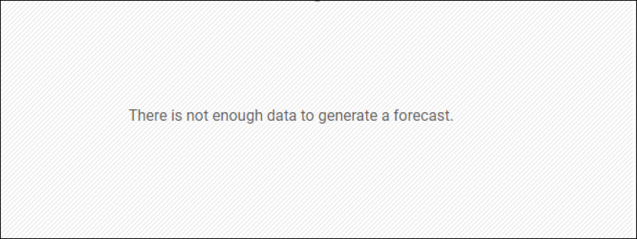
Additionally, forecast eligibility is strongly affected by the historical data available to be used in the forecasting model. Therefore, if your data exhibits gaps (e.g., missing months or low counts), a forecast may not be created, and you will see an error instead.
-
Errors often identify areas of opportunity. In some cases, they can highlight areas where data capture is not as robust as it should be. As you implement practices to improve data capture, forecasts will appear if the data starts to show a predictable pattern.
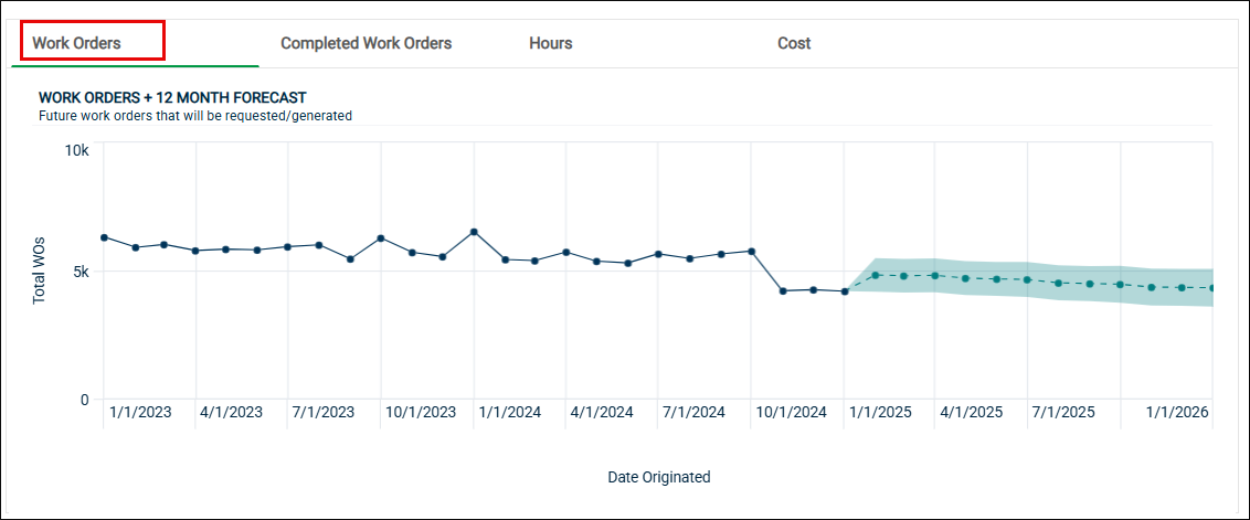
Work Orders
The chart shows a twelve-month forecast for the number of upcoming work orders, based on Date Originated. This considers all created work orders, regardless of the status. This gives you an estimate of the upcoming work you can expect and will respond to filters.
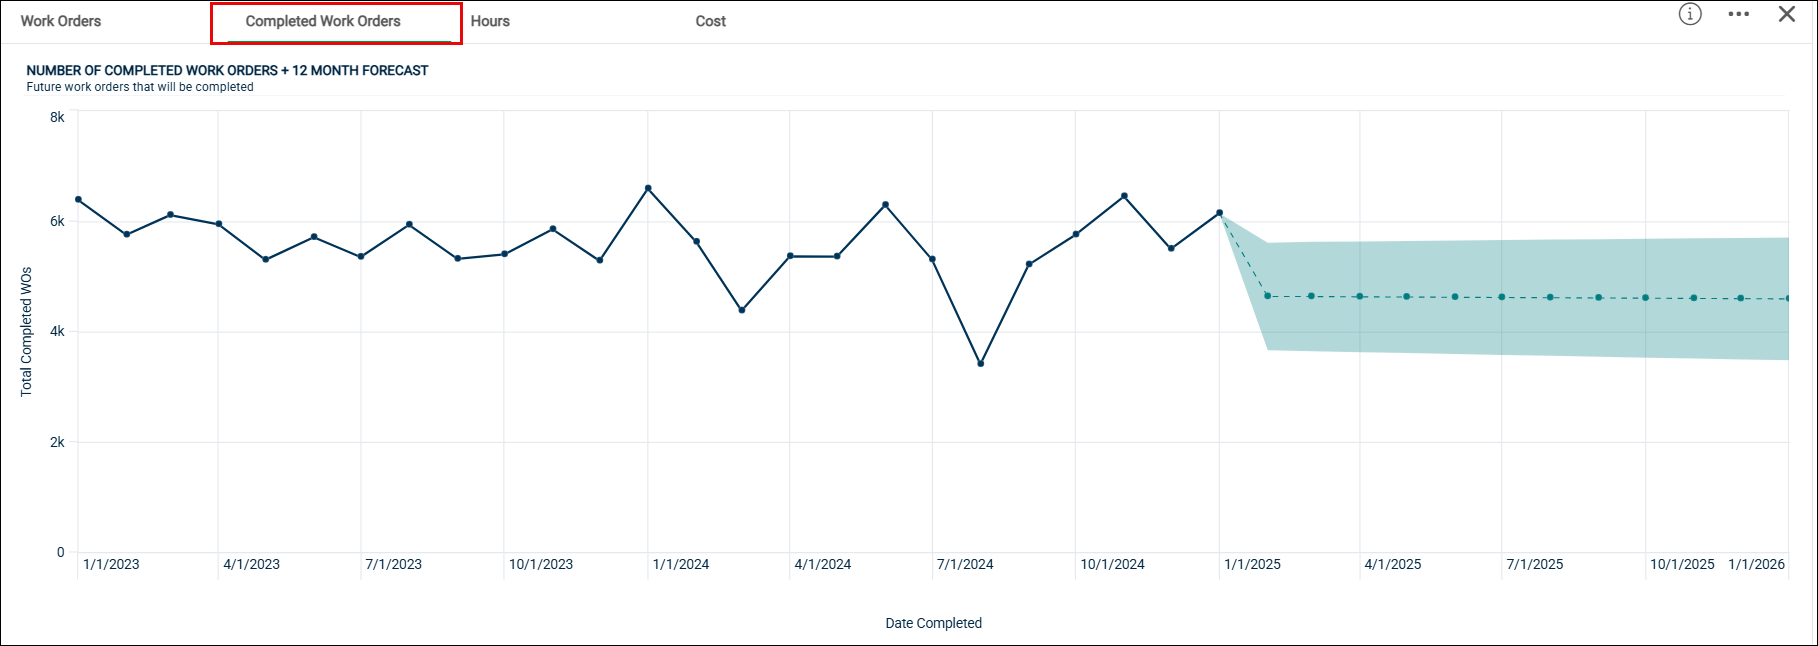
Completed Work Orders
The chart shows a twelve-month forecast for the expected number of completed work orders, which projects historical completion rates into the future.
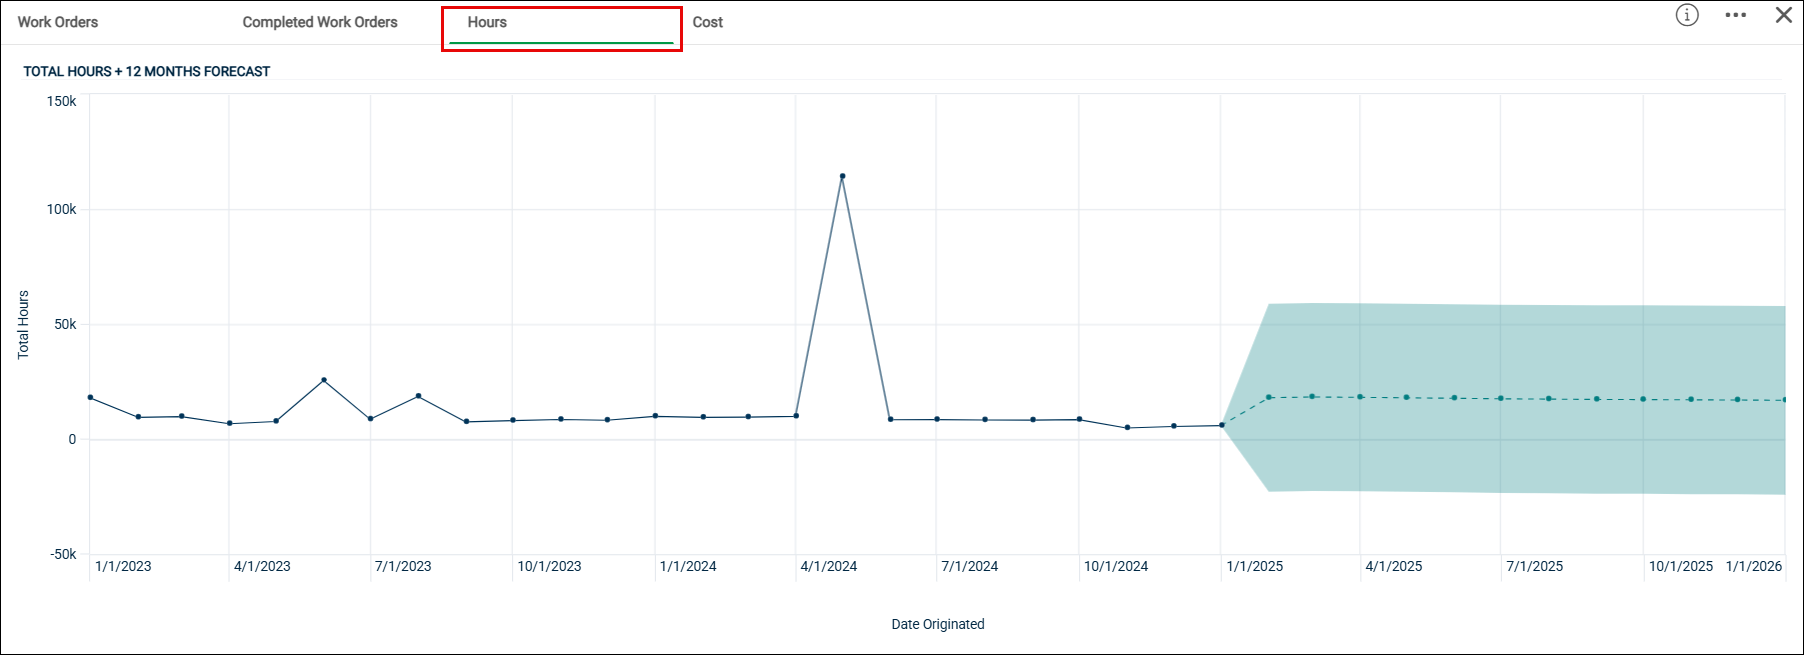
Hours
The chart shows a twelve-month forecast for upcoming hours needed to complete work orders.
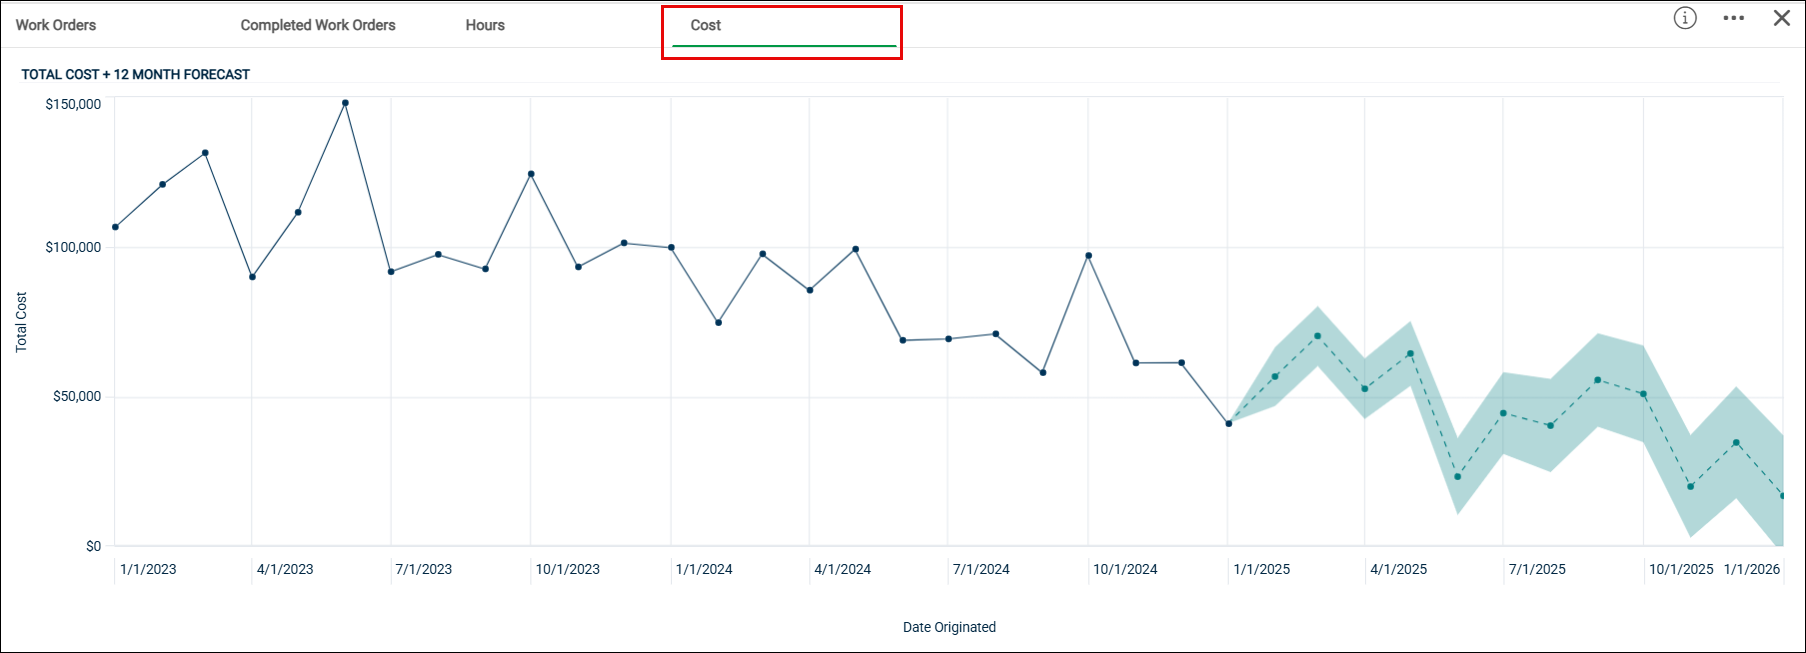
Cost
The chart shows a twelve-month forecast for the upcoming cost associated with work orders.
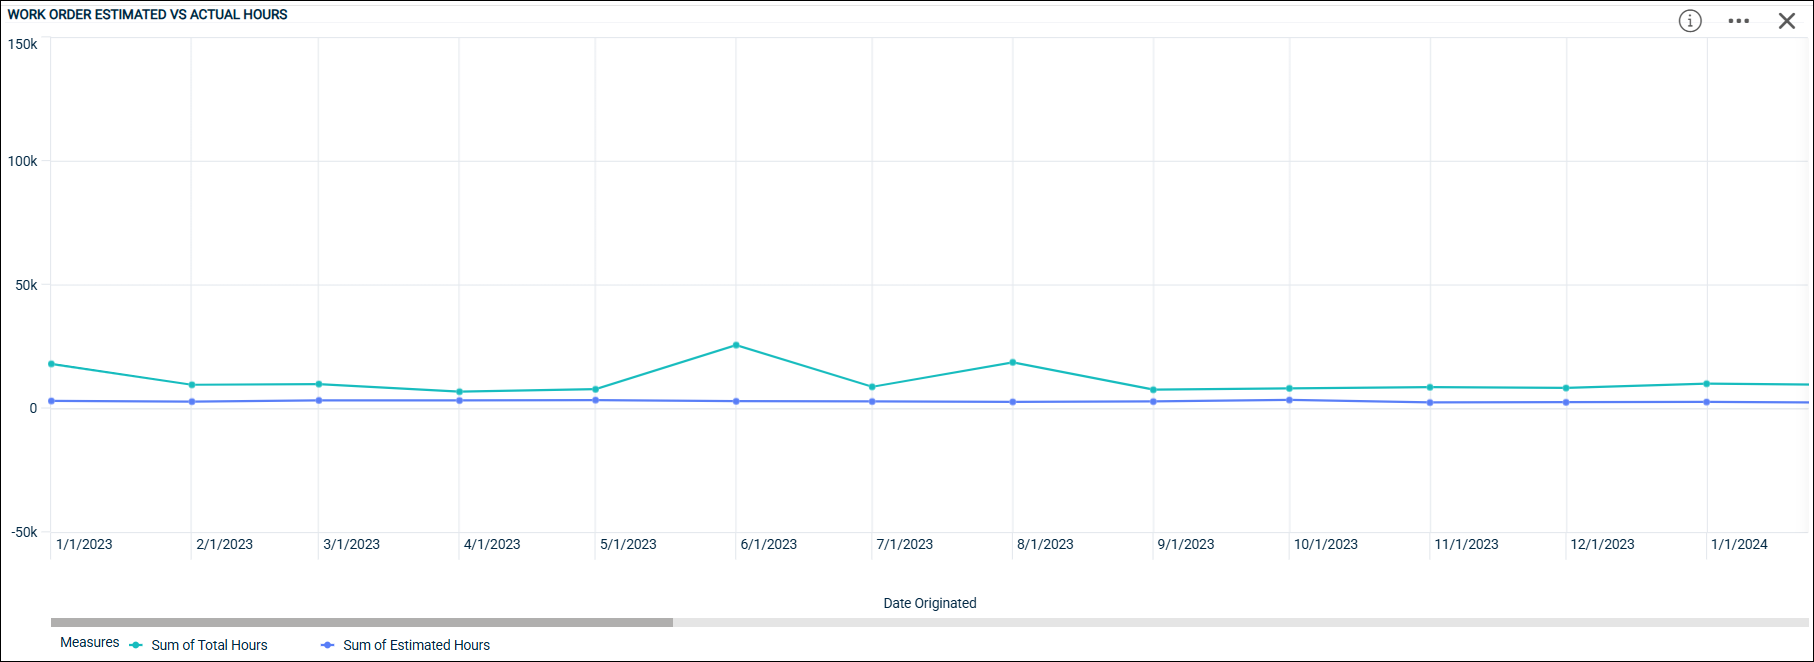
Work Order Estimated vs. Actual Hours
This chart shows the estimated work order hours alongside the actual hours associated with these work orders, as well as a forecast of the total hours, which is an extension of the long-term trends associated with actual hours on work orders. This chart helps highlight whether work order hours have typically been overestimated or underestimated in the past.
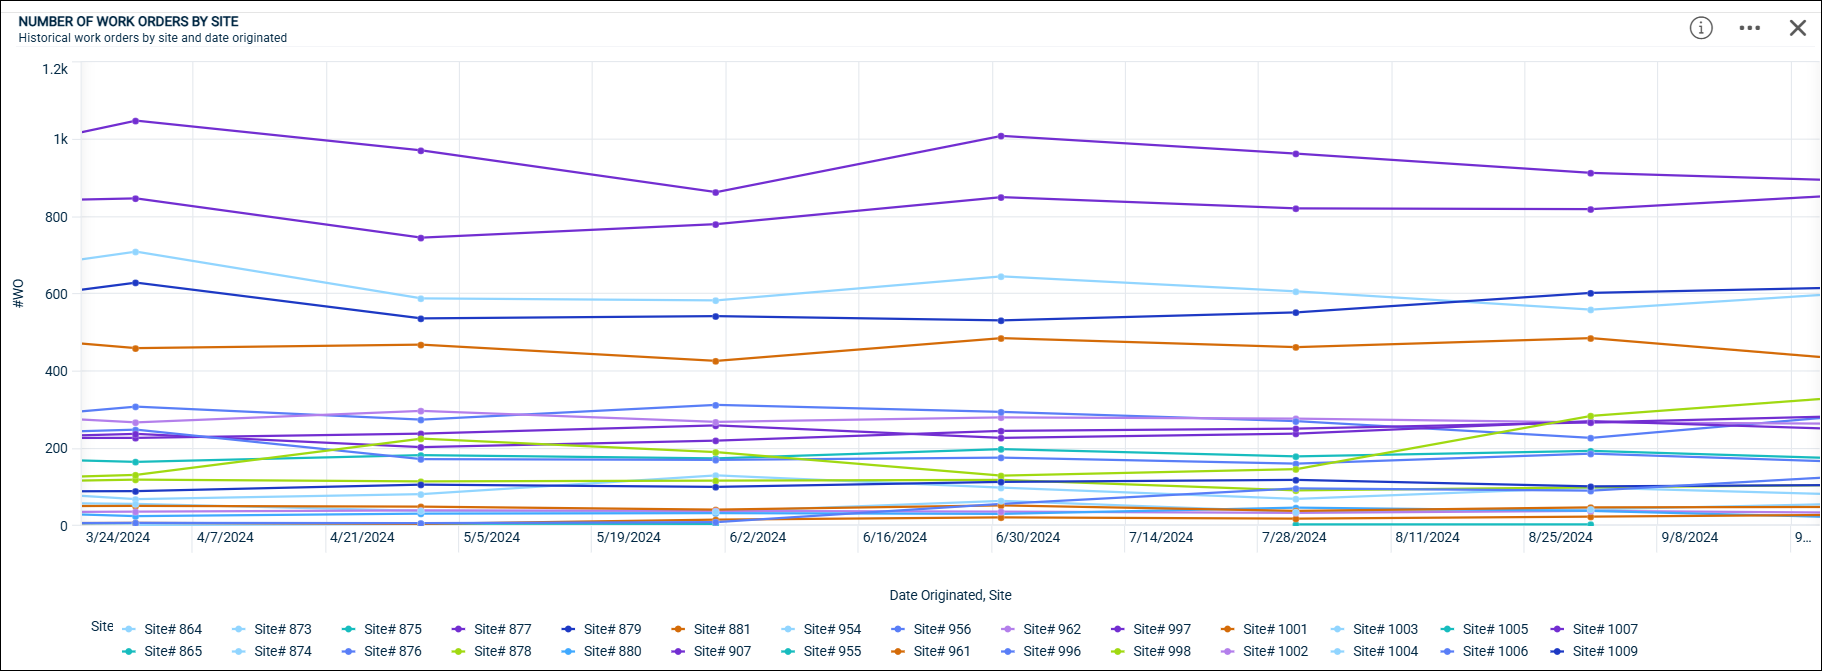
Number of Work Orders by Site
This chart shows the count of total work orders originated by site. By default, this chart will display all data available, so if your organization has many sites, the chart may be difficult to read. This chart is especially useful as you filter your data, for example, by focusing on just a few sites, or by filtering to specific Assets or PM Names.
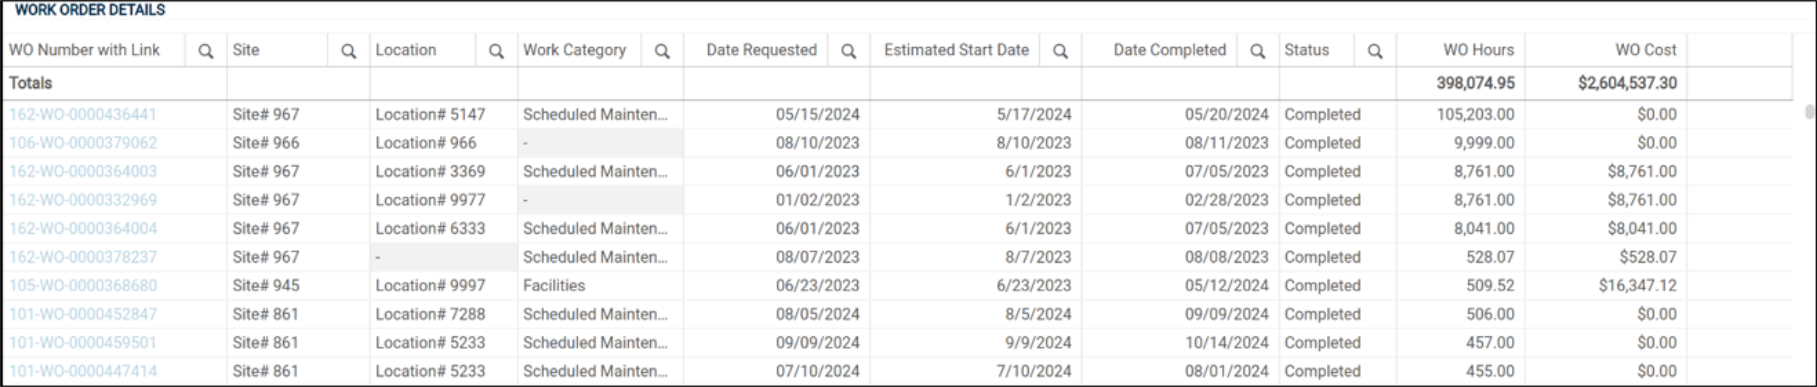
Work Order Details
This table shows some additional information about the work orders included in the dashboard, with a link to each work order in Asset Essentials.
Upcoming PMs
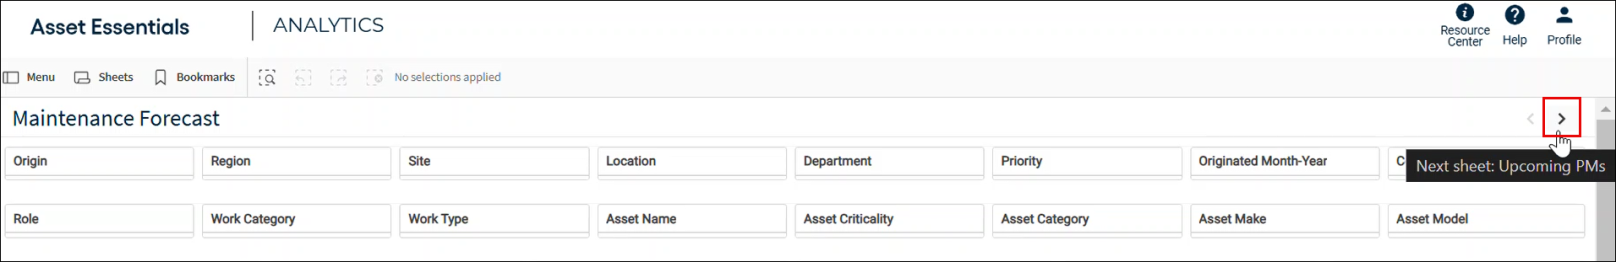
Accessing Upcoming PMs Dashboard
-
Click on the right arrow key on the top right of the Maintenance Forecast dashboard.
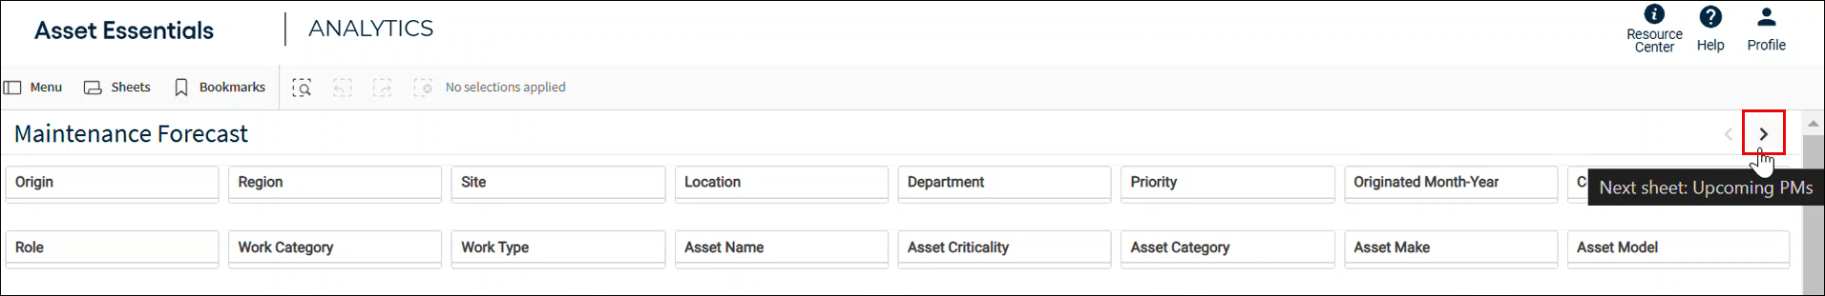
-
The Upcoming PMs dashboard appears, proceed to next section.
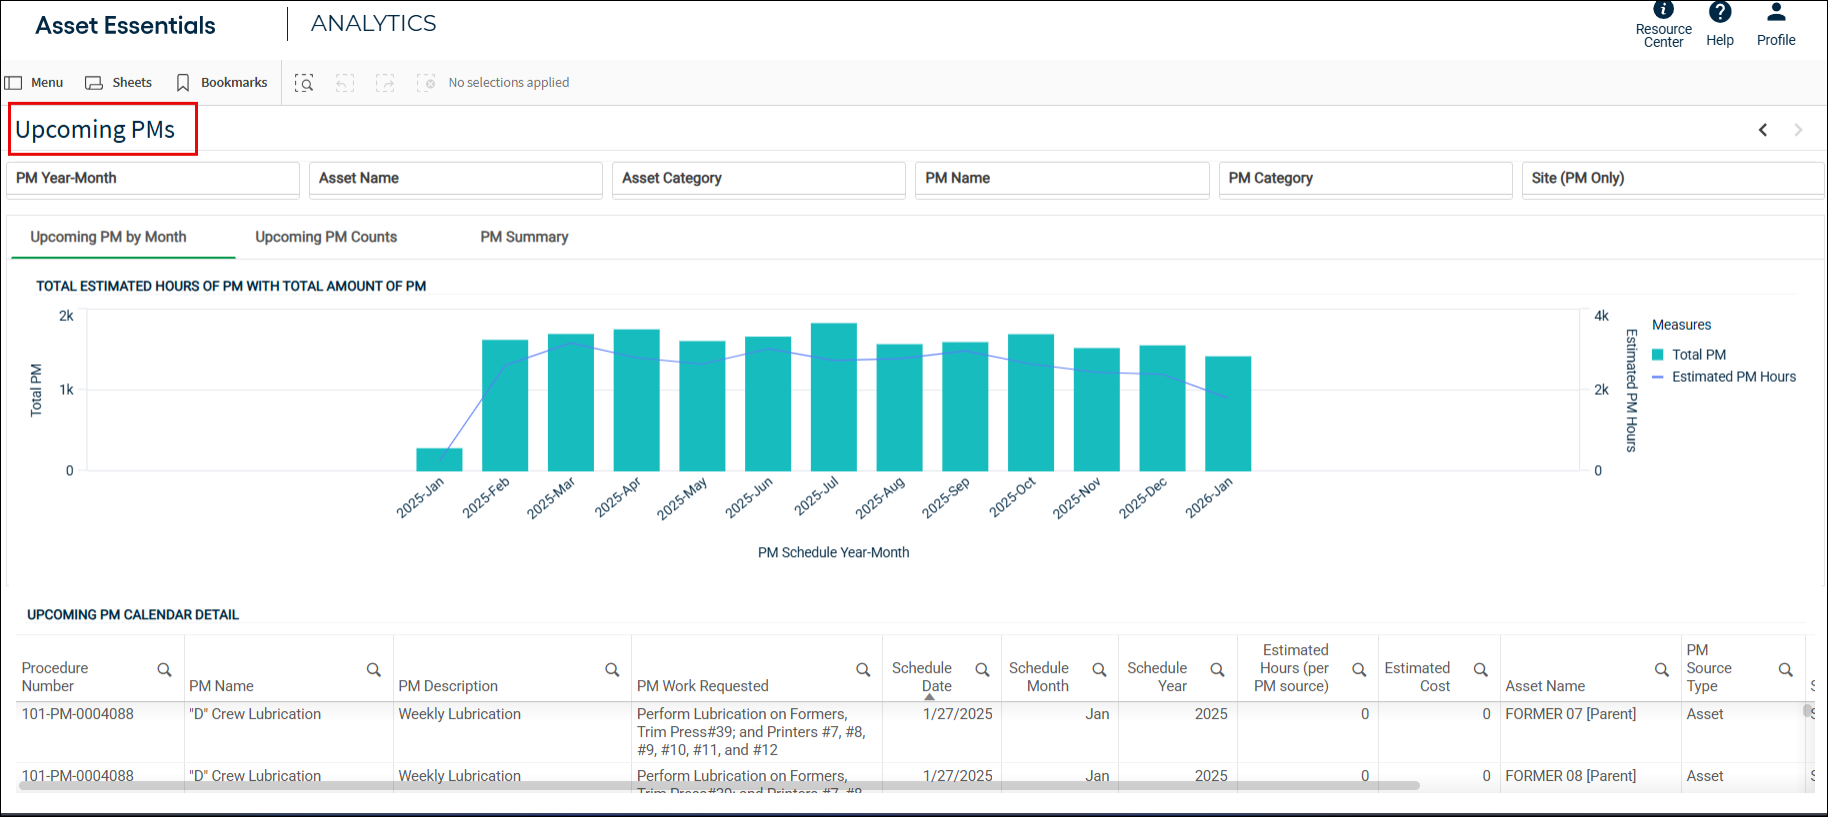
Upcoming PMs Insights
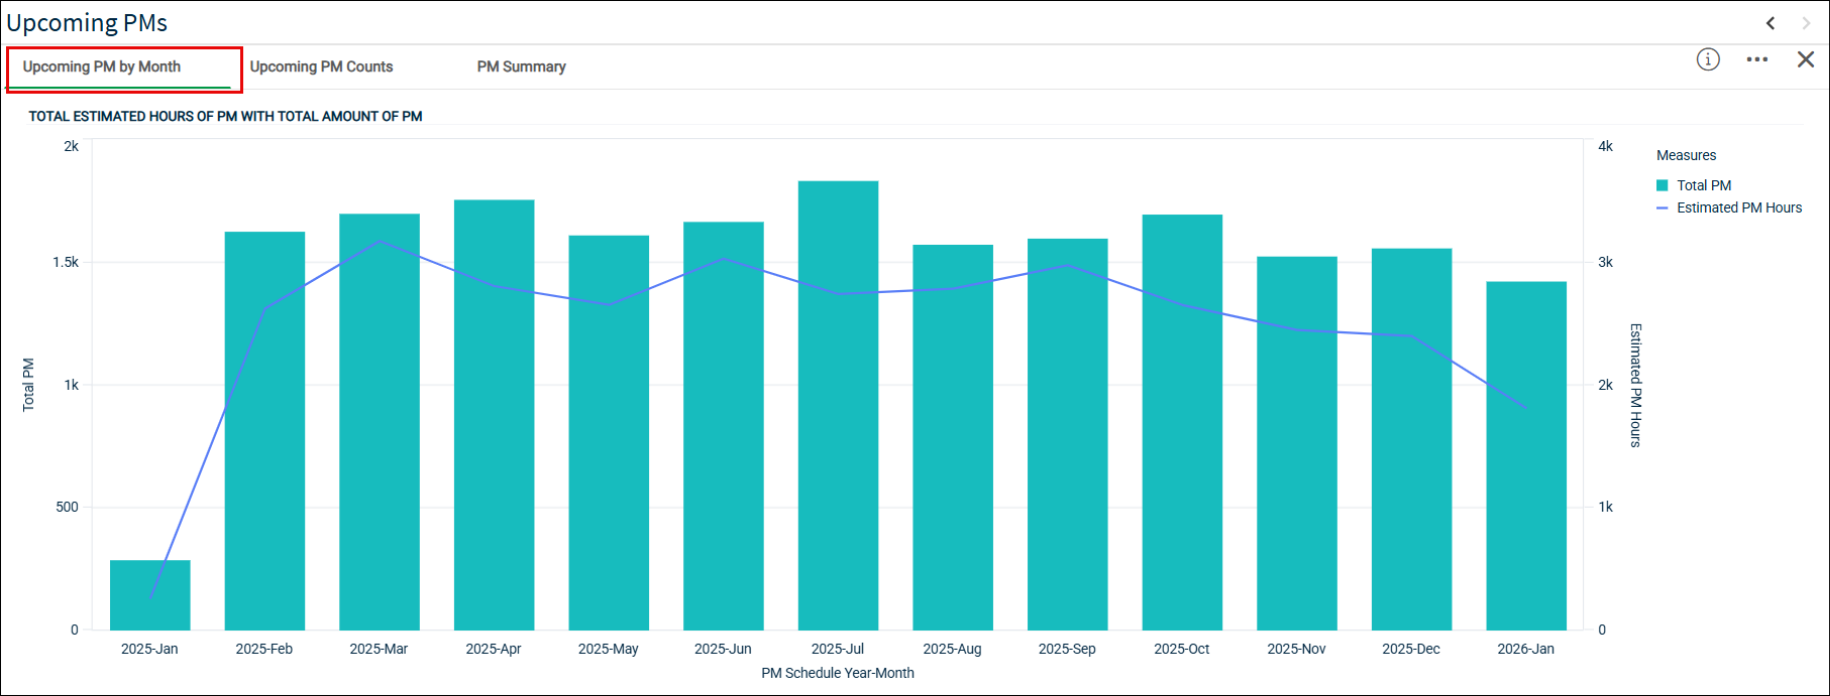
Upcoming PM by Month
This chart shows the upcoming values for both Total PM Count and Estimated PM Hours for the next 12 months, based on the data from the PM schedules. This allows you to identify months with higher or lower expected PM counts and hours in advance, which can aid in resource planning.
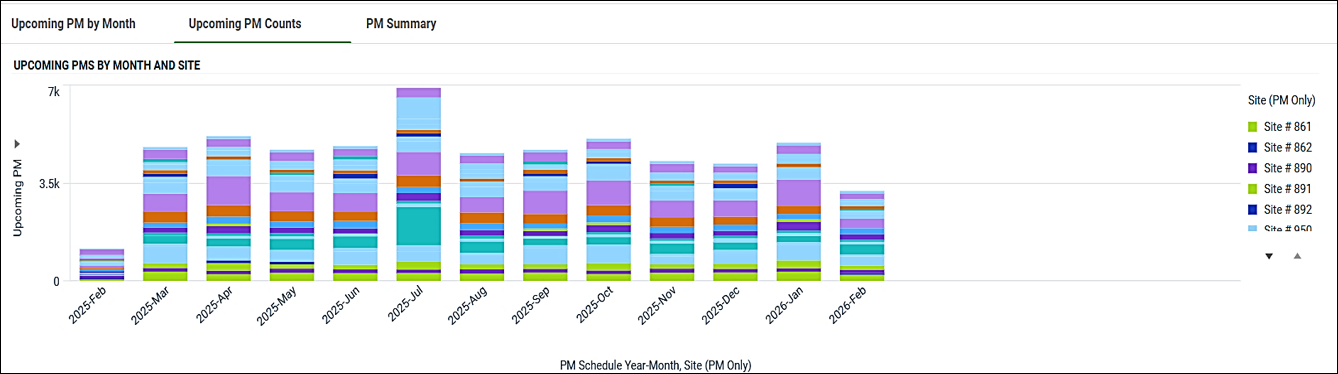
Upcoming PM Counts
The next chart displays upcoming PM counts and hours by Month and Site. The chart defaults to showing PM counts; however, you can use the toggle to view Estimated PM Hours instead. It may be useful to use the filters to view only particular months or sites to identify which sites have the highest number of PM hours coming up.
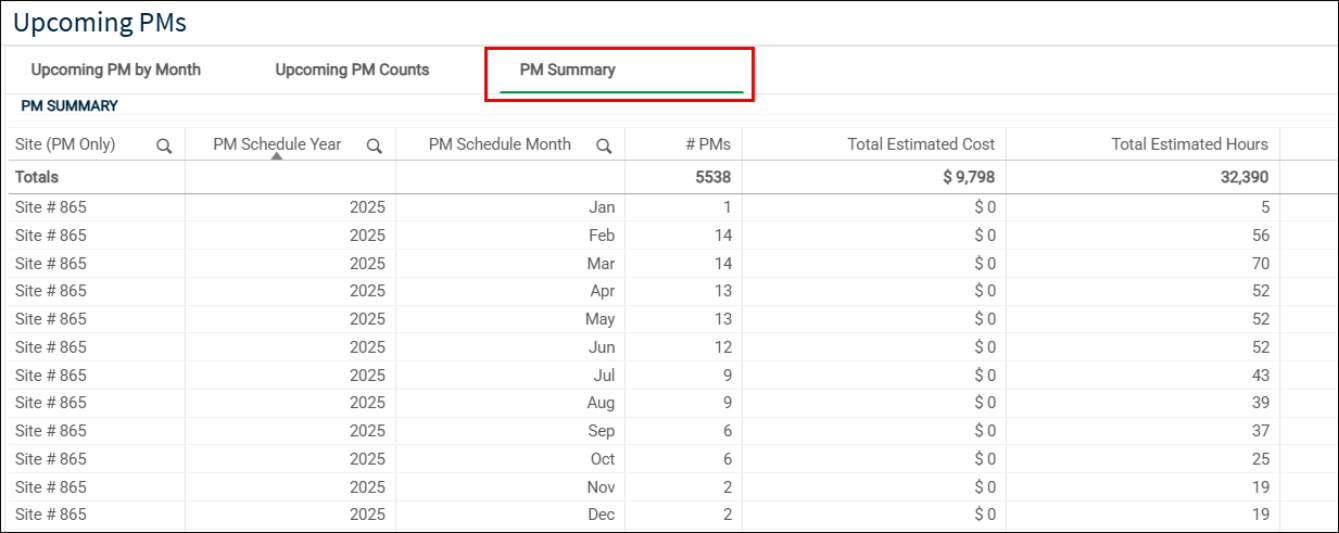
PM Summary
This shows a breakdown of the upcoming PM counts, as well as any associated cost and hours, by both site and month, for the next 12 months.
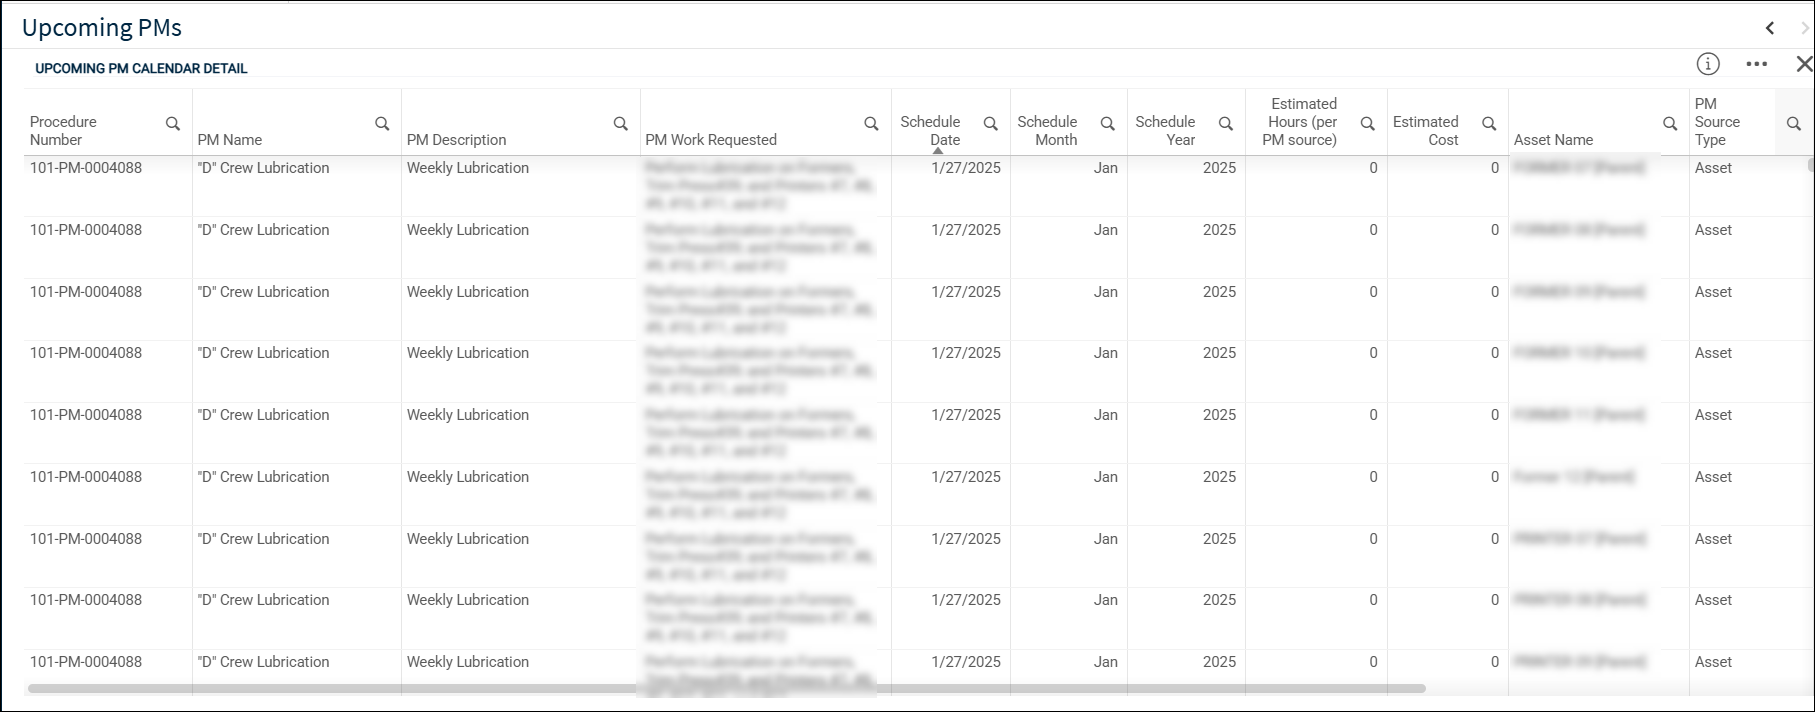
Upcoming PM Calendar Detail
The table shows the details related to the upcoming PM Work Orders, including descriptive information, schedule date, estimated hours, cost, associated assets, sites, and/or locations. By default, this table is automatically sorted by schedule date.
Switching Dashboard
-
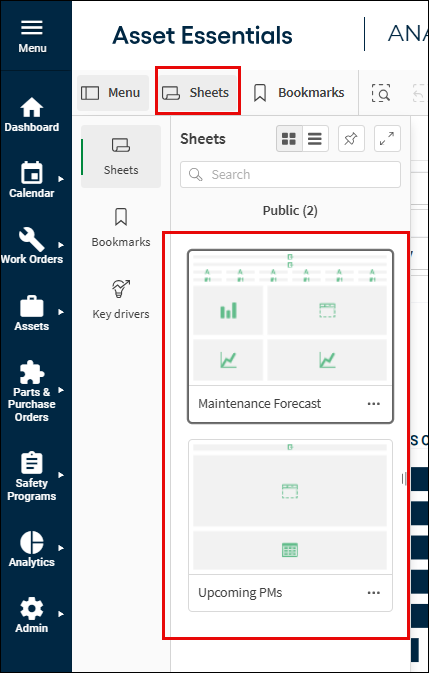
Click on the right arrow key on the top right of the Maintenance Forecast to go to Upcoming PMs or vice-versa to go back to Maintenance Forecast.
![]()
Or
-
Click Sheets, select the desirable dashboard.