Back to Asset Essentials Main Menu
Filtering, exporting, and sharing
The dashboards and KPIs available in Analytics pull data directly from your Asset Essentials account and present it in tables and graphs to help you easily see snapshots of the work taking place at your organization. You are able to filter your data to see exactly what you need, export the data to use in presentations or other applications, and share your dashboards with other users. *Note: Not all clients are eligible for Analytics. To learn if you are eligible, contact Client Services.
Filtering the dashboard
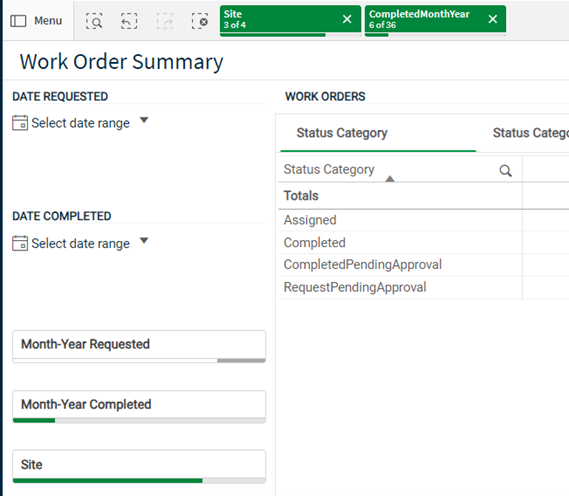
You can filter the dashboard you are on using the Filter options on the left side of the screen. There are various ways you can see what is being filtered:
-
A count of your selections for each field will appear along the top of the screen.
-
A green bar will display under each field that is being filtered, depending on your selections.
To clear your filter selections, click the dashed square with the small “x” to the left of the filter options or click the "X" next to any individual fields at the top of the dashboard.
Within each chart or section of the dashboard, you can make selections to narrow down the data.
-
Select the information in the graph or table you want to view, such as particular bars in a bar chart. The rest of the charts and tables on the dashboard you are viewing will be filtered by those selections.
Exporting tables and graphs
To export the visualizations or data found in the dashboards, simply right click on the visualization you would like to export, select ‘Download’, and then select the file format you would like to download (Data/Excel, Image, or PDF).

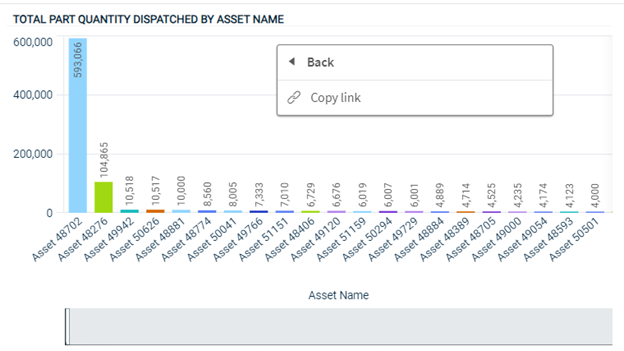
Sharing a dashboard
To share a visualization, simply right click a visualization, select ‘Share’, and then select ‘Copy link’.