Executive summary
Executive Summaries are automatically generated each month, putting your KPIs and trends into a professional PowerPoint so you can present them to your leadership teams. *Note: Not all clients are eligible for Analytics. To learn if you are eligible, contact Client Services.
The KPI data is updated every month and includes the previous 12 months of data in the KPI calculations. For example, if you are viewing your March 2025 Executive Summary, the KPIs will include data from the first of March 2024 through the end of February 2025. The visualizations with trend lines display the value of the KPI metrics by month and year for the previous two years, plus the current year.
-
Click the Analytics menu icon, then select Executive Summaries.
-
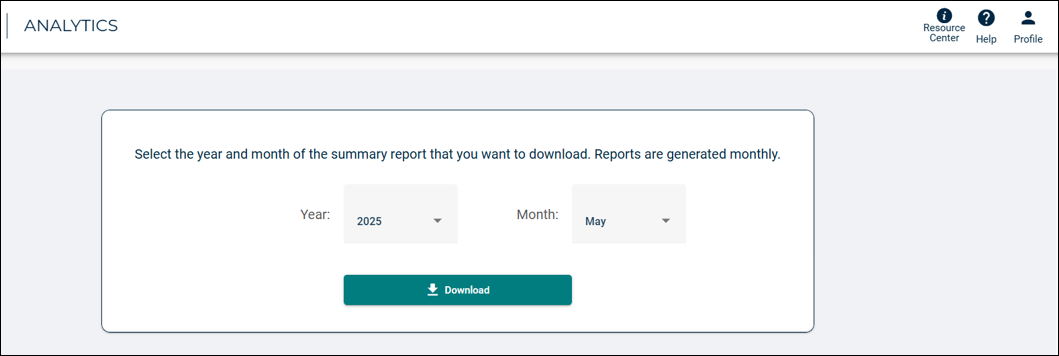
Use the Year and Month drop-down menus to select the specific summary report you want to download.
-
Click Download.
Click below to see an example of the Executive summary PowerPoint presentation: