Back to Dude Intelligence for Education Main Menu
The Maintenance Operational Dashboard allows you to drill down into your applications' data to give you a clearer picture of the work you are doing. This dashboard updates every morning with the current year's data through the previous day as well as two previous calendar years of data.
Navigating Dude Intelligence Dashboards
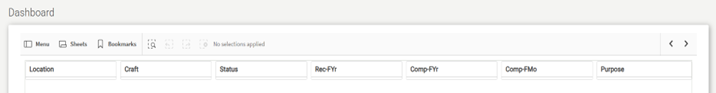
There are two options that can be used to navigate between dashboard pages in Dude Intelligence. The first option is to use left or right arrows in the upper right-hand corner of the dashboard to navigate to the previous or next dashboard, respectively.
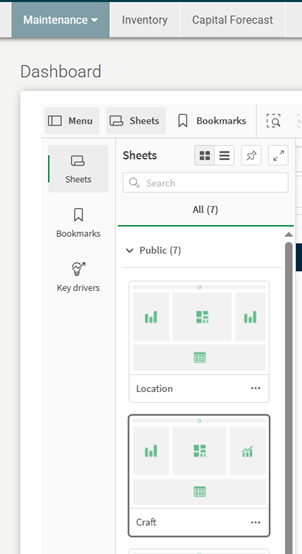
The second option to navigate between dashboards is to use the ‘Menu’ option located in the upper left-hand side of the page. This will open an additional left-side menu that shows a ‘Sheet’ icon for each available dashboard in the section of Dude Intelligence you are in. In this new menu, you can simply scroll and select the icon of the dashboard you would like to view.
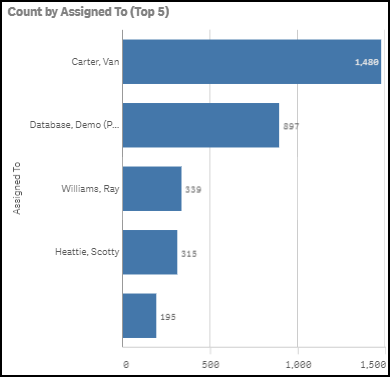
Count by Assigned To (Top 5)
Displays the top 5 work order counts by assigned employee.
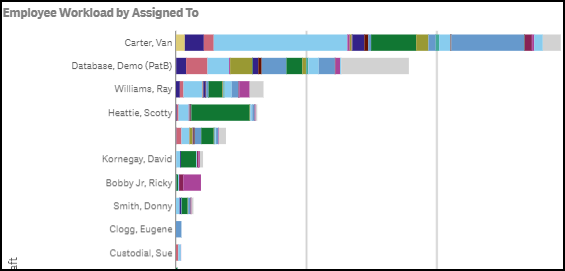
Employee Workload by Assigned To
Displays how many work orders an employee has entered by Craft. Hover over a color to see the work order count for that specific craft.
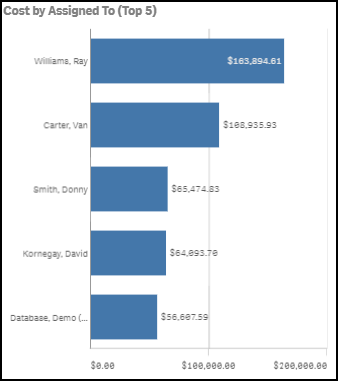
Cost by Assigned To (Top 5)
Displays top 5 work order costs by employee.
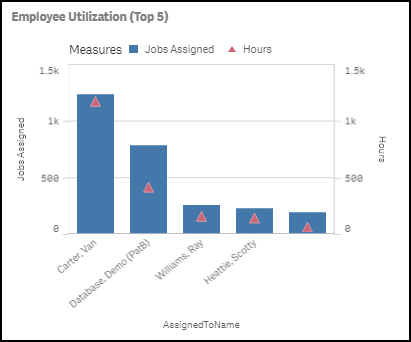
Employee Utilization (Top 5)
Displays how employees are utilizing their time by the number of jobs assigned and the hours worked.
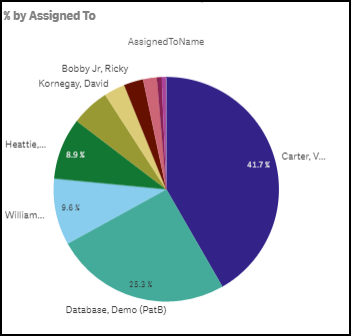
% by Assigned To
Displays employee work order count in a percentage. Hover over a section of the pie chart to see the actual work order count.
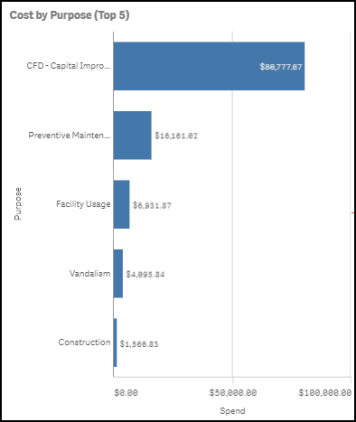
Cost by Purpose (Top 5)
Displays top 5 work order costs by Purpose Code.
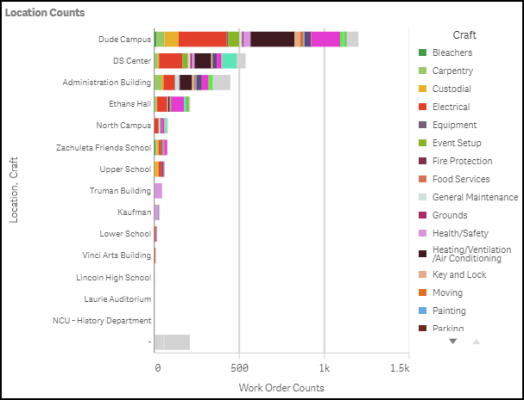
Location Counts
Displays the work order count by Location. This graph is also colored coded by Craft. Hover over a color to see the work order count for that specific craft.
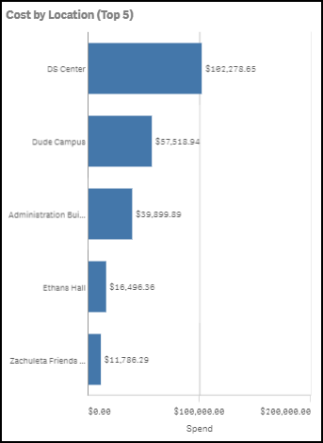
Cost by Location (Top 5)
Displays top 5 work order costs by Location
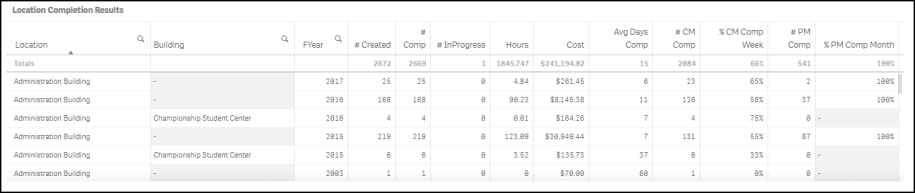
Location Completion Results
This section displays a mini Location report with work order completion details for different fiscal years.
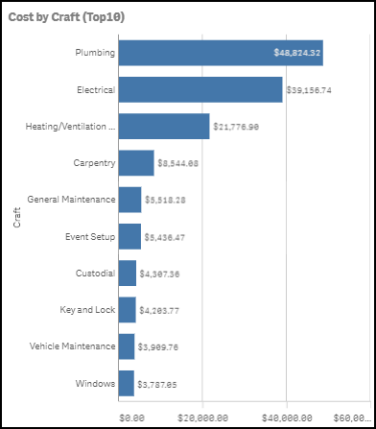
Cost by Craft
Displays work order costs by Craft.
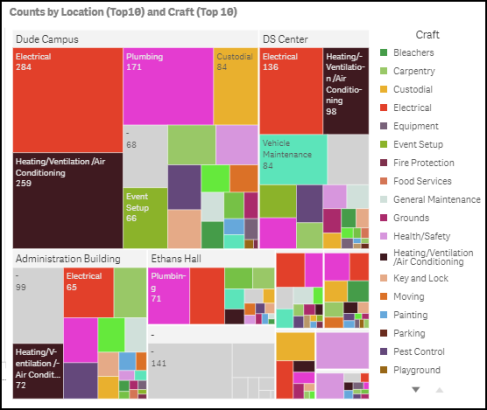
Counts by Location (Top 10) and Craft (Top 10)
Displays work order counts by craft, broken down by Location. *Note: The larger the box, the higher the work order count.
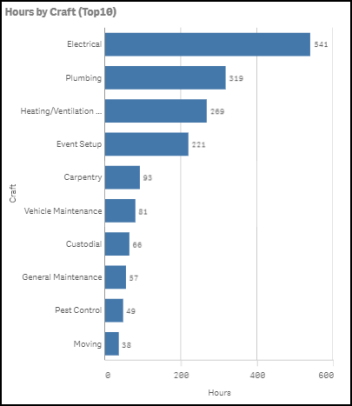
Hours by Craft (Top 10)
Displays top 10 Crafts by hours tracked.
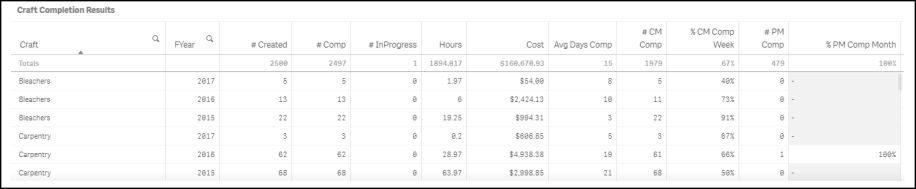
Craft Completion Results
This section displays a mini Craft report with work order completion details for different fiscal years.
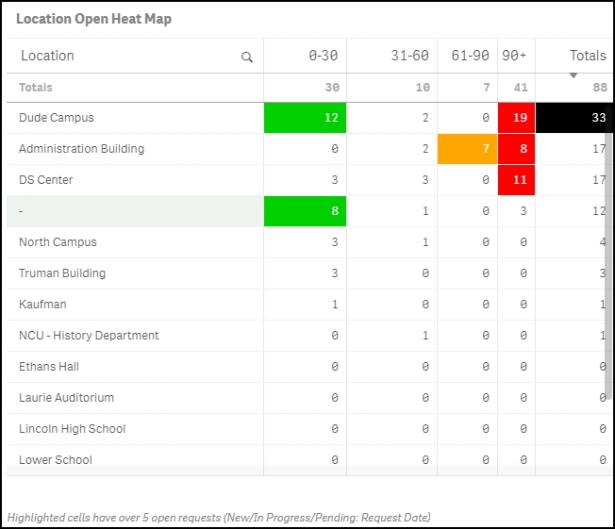
Location Open Heat Map
Displays a count of work orders that have been open for a specific number of days (i.e. 0-30 days, 31-60 days, etc.). This data is broken down by Location. *Note: Cells that are highlighted have over 5 open requests. Open requests include work orders in the status of New Request, Work In Progress, and Pending. Each column is highlighted with a different color to indicate the increase in time. The Totals column is highlighted when there are over 20 requests.
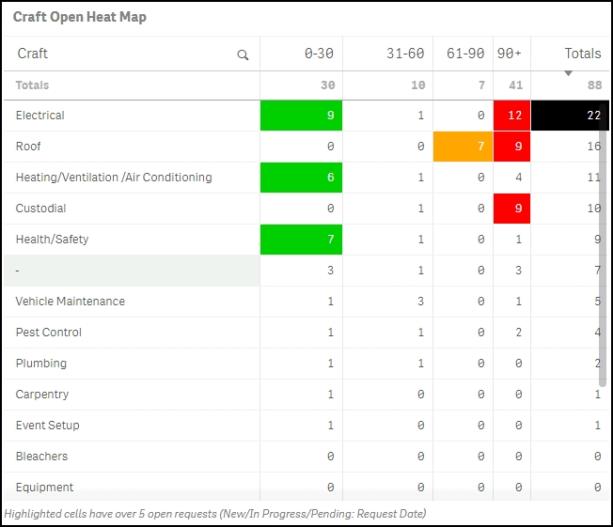
Craft Open Heat Map
Displays a count of work orders that have been open for a specific number of days (i.e. 0-30 days, 31-60 days, etc.). This data is broken down by Craft. *Note: Cells that are highlighted have over 5 open requests. Open requests include work orders in the status of New Request, Work In Progress, and Pending. Each column is highlighted with a different color to indicate the increase in time. The Totals column is highlighted when there are over 20 requests.
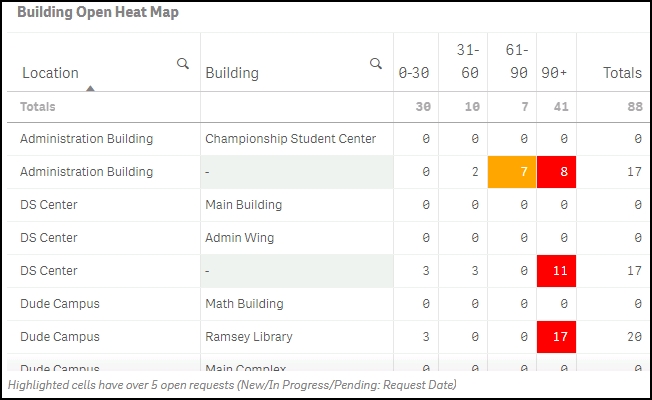
Building Open Heat Map
Displays a count of work orders that have been open for a specific number of days (i.e. 0-30 days, 31-60 days, etc.). This data is broken down by Building. *Note: Cells that are highlighted have over 5 open requests. Open requests include work orders in the status of New Request, Work In Progress, and Pending. Each column is highlighted with a different color to indicate the increase in time. The Totals column is highlighted when there are over 20 requests.
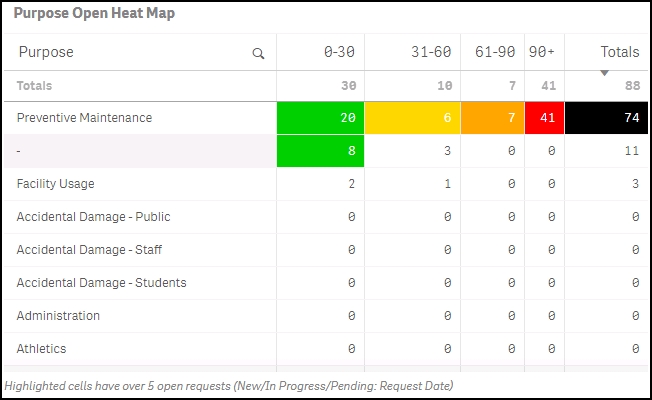
Purpose Open Heat Map
Displays a count of work orders that have been open for a specific number of days (i.e. 0-30 days, 31-60 days, etc.). This data is broken down by Purpose. *Note: Cells that are highlighted have over 5 open requests. Open requests include work orders in the status of New Request, Work In Progress, and Pending. Each column is highlighted with a different color to indicate the increase in time. The Totals column is highlighted when there are over 20 requests.
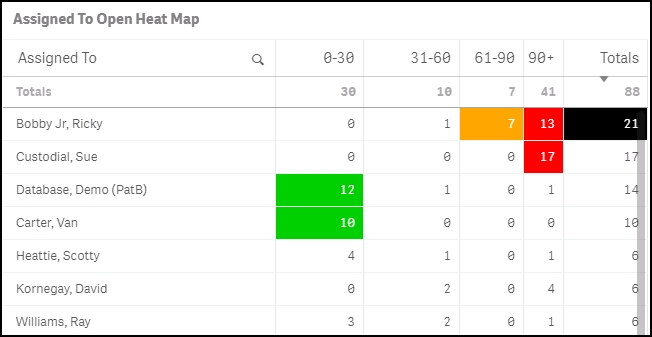
Assigned To Open Heat Map
Displays a count of work orders that have been open for a specific number of days (i.e. 0-30 days, 31-60 days, etc.). This data is broken down by Assigned To. *Note: Cells that are highlighted have over 5 open requests. Open requests include work orders in the status of New Request, Work In Progress, and Pending. Each column is highlighted with a different color to indicate the increase in time. The Totals column is highlighted when there are over 20 requests.
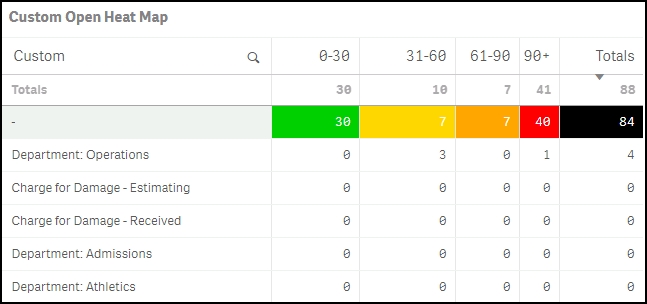
Custom Open Heat Map
Displays a count of work orders that have been open for a specific number of days (i.e. 0-30 days, 31-60 days, etc.). This data is broken down by Custom Category field. *Note: Cells that are highlighted have over 5 open requests. Open requests include work orders in the status of New Request, Work In Progress, and Pending. Each column is highlighted with a different color to indicate the increase in time. The Totals column is highlighted when there are over 20 requests.
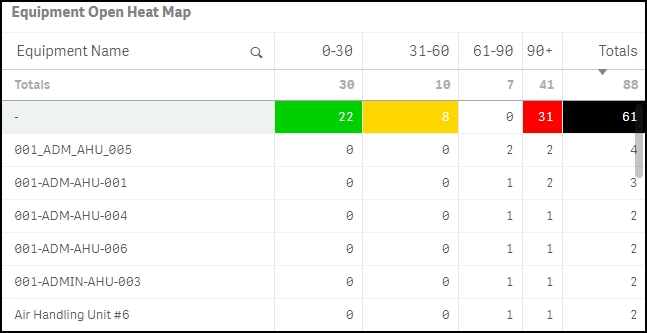
Equipment Open Heat Map
Displays a count of work orders that have been open for a specific number of days (i.e. 0-30 days, 31-60 days, etc.). This data is broken down by Equipment. *Note: Cells that are highlighted have over 5 open requests. Open requests include work orders in the status of New Request, Work In Progress, and Pending. Each column is highlighted with a different color to indicate the increase in time. The Totals column is highlighted when there are over 20 requests.
A work order is considered on time if it has been completed by the Target Completion Date or the Requested Completion Date on the work order form. If the work order is completed after one of these dates, it is considered not completed on time. If there is not a Target Completion Date or a Requested Completion Date entered on the work order form, the system looks at the Priority to determine the length of time for completion:
- Low - user has 60 days to complete the work order from the request date to consider it on time.
- Medium - user has 30 days to complete the work order from the request date to consider it on time.
- High - user has 15 days to complete the work order from the request date to consider it on time.
- Emergency - user has 3 days to complete the work order from the request date to consider it on time.
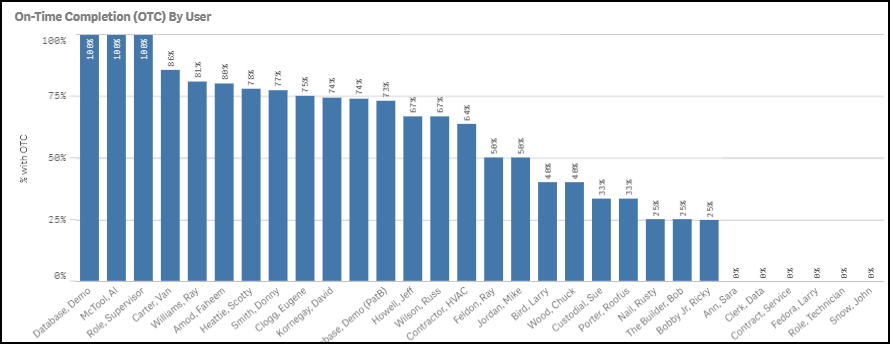
On-Time Completion (OTC) By User
Displays the on-time completion percentage by user.
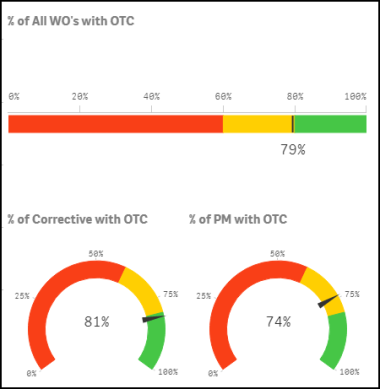
% of All WO's with OTC
Displays the on-time completion percentages for corrective maintenance, planned maintenance, and both combined. On the graphs, you will see a small indicator that represents where your organization is performing compared to peers in your industry. Your value will be displayed below the graph or in the middle of the circular graphs.
Green - The green section represents the top 20% of education clients.
Yellow - The yellow section represents average performance.
Red - The red section represents below average performance.
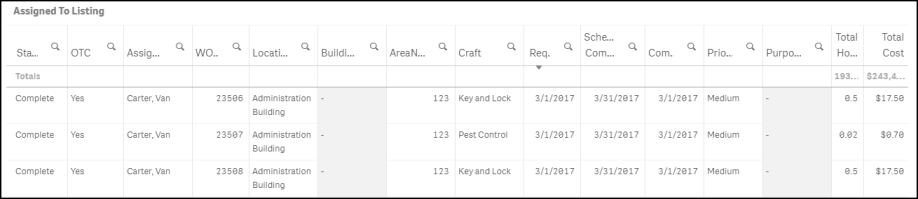
Assigned To Listing
This section displays a mini Assigned To report with work order on-time completion details.
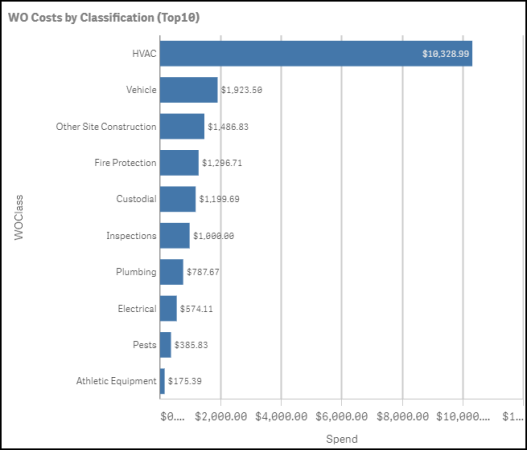
WO Costs by Classification (Top 10)
Displays the top 10 Classifications by work order costs.
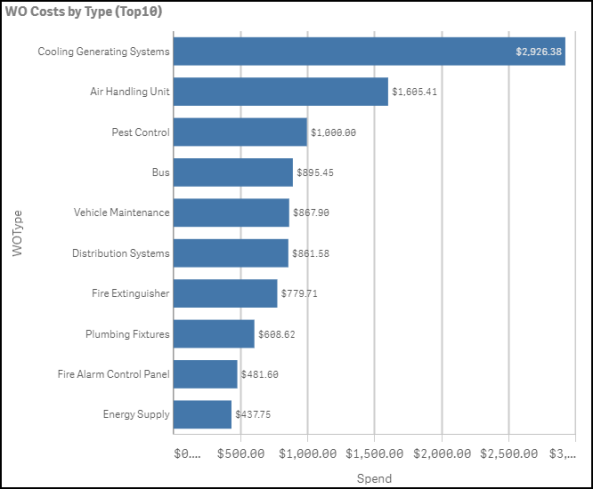
WO Costs by Type (Top 10)
Displays the top 10 Types by work order cost.
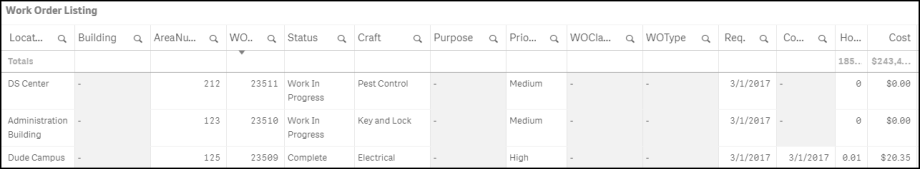
Work Order Listing
This section displays a mini report with work order details including columns for Classification and Type.